-
PDF
- Split View
-
Views
-
Cite
Cite
Junjun Zhang, Syed Haider, Joachim Baran, Anthony Cros, Jonathan M. Guberman, Jack Hsu, Yong Liang, Long Yao, Arek Kasprzyk, BioMart: a data federation framework for large collaborative projects, Database, Volume 2011, 2011, bar038, https://doi.org/10.1093/database/bar038
Close - Share Icon Share
Abstract
BioMart is a freely available, open source, federated database system that provides a unified access to disparate, geographically distributed data sources. It is designed to be data agnostic and platform independent, such that existing databases can easily be incorporated into the BioMart framework. BioMart allows databases hosted on different servers to be presented seamlessly to users, facilitating collaborative projects between different research groups. BioMart contains several levels of query optimization to efficiently manage large data sets and offers a diverse selection of graphical user interfaces and application programming interfaces to ensure that queries can be performed in whatever manner is most convenient for the user. The software has now been adopted by a large number of different biological databases spanning a wide range of data types and providing a rich source of annotation available to bioinformaticians and biologists alike.
Database URL:http://www.biomart.org
Introduction
Biological data are complex and require specialized expertise for their collection, analysis and interpretation. As a consequence of this, different biological data sources are distributed around the world, clustered around centres of such expertise. Each of these centres has its own solution for storing and presenting its data. The creation of these solutions results in duplicated effort by researchers and frustration for users who must learn how to query multiple interfaces. Both data producers and consumers would benefit from a standardized solution.
Increasingly, biological research involves collaborations between several groups, which are often geographically distant. For example, large-scale collaborative efforts have been established to comprehensively study cancer genomes (1, 2). This can result in the data for a single project being stored in different locations. To facilitate such collaborations, technology is required that enables data at multiple sites to be interlinked and presented as a unified source, allowing researchers to perform integrative analyses.
Next-generation sequencing (NGS) and other high-throughput technologies generate large amounts of data at unprecedented speed. After primary analyses, interpretation of these types of data is greatly facilitated through links to public annotations, which are typically not stored on the same servers as the NGS data. Since these data sets are so large, exchanging the data across servers is impractical. A solution that is both scalable and distributed is needed to facilitate this type of annotation.
Many of the traditional solutions to these problems are based on centralized models. On the one hand, raw data repositories, such as the European Genome–phenome Archive (3) and the Sequence Read Archive(4), offer low-level data. In order to properly analyse and interpret the data, a substantial amount of resources and expertise on the part of the users is required. On the other hand, specialized data repositories, such as Ensembl (5) and UCSC (6), offer processed data. These are the products of a significant commitment of resources and expertise by the host institution. Because of this large investment, they are unlikely to scale as data grows, and it is difficult for them to accommodate new data types. Both approaches have limitations.
To address these problems, we have created BioMart, an open-source data federation system. BioMart, originally written for the Ensembl databases (7), has become a popular choice for managing many types of biological databases. The BioMart data management system is based on a federated model, under which each data source is released and updated independently by its host institute. As each data provider stores and processes its own data locally, the scalability of the system is improved. BioMart contains an integration layer that provides a unified view of all the data sources, such that the user is not aware of the fact that the data are stored on multiple servers. BioMart has a flexible data model, so that it can be used with a wide range of biological data types, and built-in query optimizations make it suitable for use with very large data sets. Due to these features, members of collaborative groups are able to maintain their own data sources independently, while providing a unified access point for all of the data generated by their project.
Overview
BioMart is a database federation system that makes it possible to present geographically distributed data sources as if they were one integrated database. Regardless of the structure underlying each data source, it can be presented to the user as a BioMart data set, which is a collection of filters and attributes. Attributes are pieces of information that a user can retrieve from the system, and filters restrict the query to narrow the results. In this way, users can interact with each data source in a simple and uniform way without the necessity of learning the underlying data model.
A BioMart server can directly access its own local databases and can communicate with other BioMart servers in order to retrieve data from remote databases. A BioMart server that provides access to a collection of data sources is referred to as a BioMart ‘Portal’. A BioMart Portal can be configured in a ‘master/slave’-like architecture, where individual servers present only their own data sources, while a single ‘master’ server acts as a portal providing a unified view over all the sources (Figure 1A). Alternatively, servers can be configured in a ‘peer-to-peer’-like architecture, where each of the individual servers links to all of the other servers in the group, such that, all servers act as a portal providing access to all the data (Figure 1B).
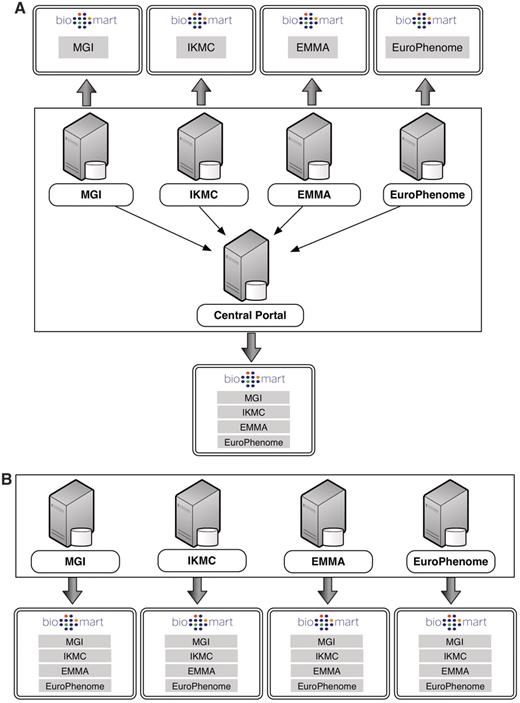
BioMart Portal architecture. The BioMart Portal can be deployed in either of two different types of server architectures. In the ‘master/slave’-like architecture (A) each ‘slave’ server only provides access to its own local data, while the ‘master’ server acts as a portal presenting a unified view over data residing on all the ‘slave’ servers. In the ‘peer-to-peer’-like architecture (B) each server not only provides data access to its own data source, but also data from all other servers. In this way, every server acts as a data portal providing access to all the data.
A BioMart Portal can be interrogated via several web-based graphical user interfaces (GUIs), programmatic interfaces and third-party tools. Regardless of the querying method, when a user launches a query, it is sent to the BioMart query engine. The query engine breaks the query down to be distributed to the individual data sources. The results are returned back to the query engine, which recompiles the data into a single result set to be presented back to the user, or to be processed further using BioMart’s extensible plugin architecture.
BioMart includes a number of query optimizations to improve querying speed. These include optimized relational schema, support for physical partitioning of data sets (either on a single server or on multiple servers), coupled with parallel query processing. To increase performance when joining multiple data sources, BioMart offers the optional use of pre-computed indexes.
BioMart includes security features, allowing administrators to control access to certain data sets based on user privileges. Data transfer can also optionally be performed using the secure HTTPS protocol, both between servers and to and from clients.
Design and implementation
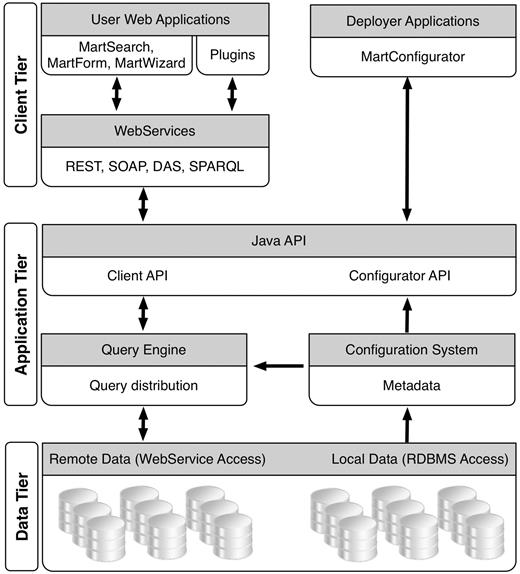
The BioMart software is a Java application with an integrated web front-end, making it possible to create, configure and deploy a BioMart server instance with a few clicks of the mouse. The BioMart system is organized in three levels: the database tier, the application tier and the client tier (Figure 2). The database tier deals with how data are organized, stored and managed in the relational database. The client tier deals with how the querying interface and query results are presented to users. Bridging these two is the application tier, which stores and retrieves metadata and executes queries, sends them to the appropriate destination, receives data in response and finally organizes the results before sending them back to the client tier.
Database
Schema
In order for a data source to be included in the BioMart system, it needs to be presented as a BioMart data set. Each data set is organized in a query-optimized, relational BioMart schema in a format called ‘reverse star’ (7). This schema has been optimized for fast retrieval of large quantities of descriptive data. The design was derived from a warehouse star schema (8), and its adaptation for descriptive data required that certain key characteristics of the classic star schema be ‘reversed’. Thus, the relation of the central (‘main’) table to those in the satellite (‘dimension’) tables is one-to-many or in some cases many-to-many rather than many-to-one; the primary keys of the central table are the foreign keys in dimension tables, and the main tables are in general, smaller than the dimension tables. Main table columns are typically the source of query constraints, as opposed to dimension tables in the classical star schema. By starting queries with the smaller table, many results are filtered out early in the querying process, thereby streamlining the entire search path. To add further flexibility, more than one main table is allowed, with main and submain tables having a one-to-many relation. Each main table can have its own dimension tables (Figure 3). To provide further query optimization, a data set can be partitioned into separate physical schemas on either the same database server or different database servers.
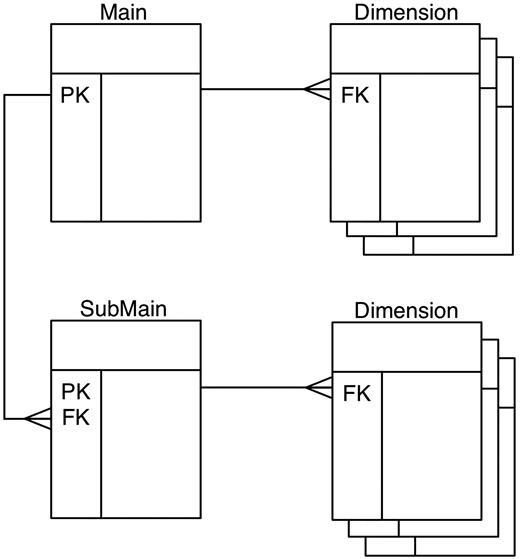
Reverse star schema. This data set has one main table and one submain table, each of which has several dimension tables. Main and submain tables have one-to-many relations, while the relations between main and dimension tables are one-to-many.
Schema transformation algorithm
BioMart can automatically convert any database that is organized in third normal form (3NF) into a reverse star schema. The algorithm works as follows: starting from a user-defined ‘candidate main’ table, it finds the longest paths of 1:1 or M:1 relations between the candidate main table and all other tables. Walking along these paths, it performs joins and then merges these tables together to create the main table. Multiple candidate tables can be given as input in which case the algorithm creates main tables out of each selected candidate table. Once the main tables are completed, if there is a 1:M relation between them they become main and submain tables. If there is no 1:M relation between them, they are split into separate data sets. Any tables that have a 1:M or many-to-many (M:N) relation with the newly created main table or submain table are the starting points to build independent dimension tables. Creating a dimension table follows the same algorithm as building a main table. Figure 4 shows an example of schema transformation. The newly created data set with its reverse star schema is a denormalized version of the source relational database. This structure offers better query performance by eliminating the necessity of joining large number of tables.
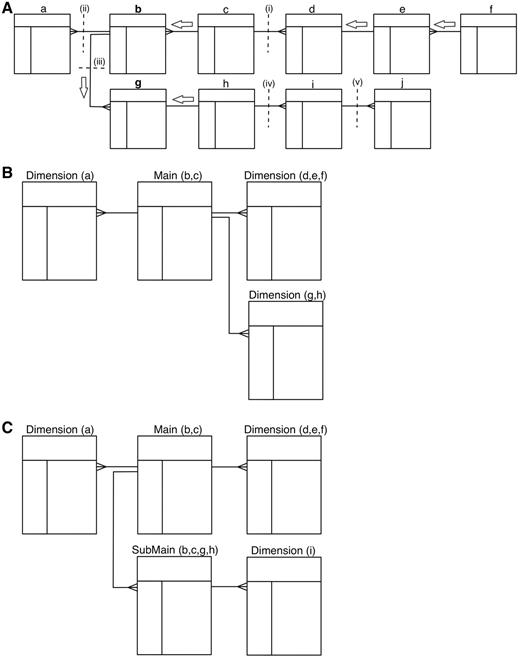
Transformation algorithm. A schematic showing how a 3NF schema is transformed into a reverse star schema. (A) Shows the 3NF schema with 10 tables, with relations between tables indicated by connectors. To build a main table, the algorithm starts from the candidate table and walks outwards along all possible paths of related tables until a one-to-many relation is encountered. Such a one-to-many relation is called a break point. When starting from table b, there are three break points: i–iii; when starting from table g, the break points are: i, ii and iv. Tables traversed before reaching the break point will be merged via an SQL join to create the main table. Tables b and c are merged when table b is chosen as the candidate main; tables b, c, g and h are merged to build the main table when table g is chosen as the candidate. The same traversing and merging rule is applied for building dimension tables. (B) Shows the resulting reverse star schema when table b is chosen as the candidate main table. The transformed schema includes one main table (the original tables b and c merged) and three dimension tables: the original table a becomes the first dimension table, tables d, e and f are merged to form the second dimension table and tables g and h are merged to create the third dimension table. (C) Shows the resulting reverse star schema when both tables b and g are chosen as candidate main tables. In addition to one main table and two dimension tables that are the same as in B, there is one new submain table that is built by merging tables b, c, g and h. The original table i becomes a dimension table to the submain table. Note that, the submain table and main table have a many-to-one relation, and the submain table contains all the contents of the main table.
In the aforementioned schema transformation, it is possible to just generate a view of the reverse star schema instead of physically creating the tables. A data set that is based on a reverse star schema view is referred to as a non-materialized data set. Setting up a non-materialized data set is useful for building a quick prototype or for small databases.
SQL compilation
BioMart is able to query both materialized and non-materialized data sets. The SQL is compiled automatically based on user input, taking into account whether the data set is materialized or not. In the case of materialized data sets, the query compilation defines the SQL path through the schema by choosing the relevant main (or submain) table at run-time based on which table columns are involved in the query. This feature makes it possible to adjust the granularity of the output and avoid redundancy in the result set. In the case of non-materialized data sets, the SQL is compiled against the source 3NF schema. The schema transformation algorithm described above provides the necessary information about the series of joins that would be used to create the materialized tables. This information is used to dynamically perform the series of joins against the source schema 3NF tables with any unused data source tables omitted for efficiency. To ensure cross-platform portability, only standard ANSI SQL statements are used for querying. At the time of writing, BioMart supports five major RDBMS platforms: MySQL, PostgreSQL, Oracle, DB2 and MS SQL server.
Query engine.
Query engine is responsible for query processing, distributing the queries to underlying data sources for execution, and collecting the query results. The query processing is a multi-step process (Figure 5). The first step is validation. This step ensures that all of the elements in the query exist and enforces any restrictions set by the data provider. If the query contains multiple data sets, it ensures that those data sets can be linked together. After passing validation, the query is split into smaller subqueries, if possible. Subqueries are run in parallel, facilitating scalable and robust querying.
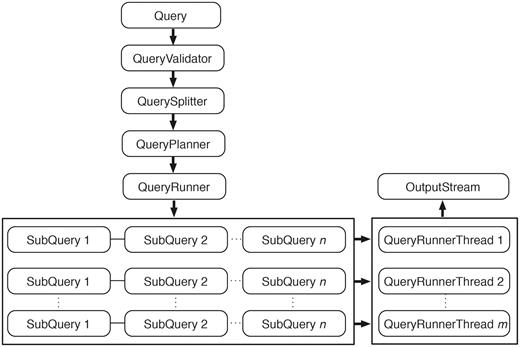
Query engine. An incoming query is first passed to QueryValidator to ensure the requested resources exist. Once validated, this original query is split into smaller subqueries if it involves attributes or filters from multiple data sets. QueryPlanner then decides the optimal order in which the subqueries should be executed; this involves checking whether a relevant link index exists (and consulting it if it does) and determining which subqueries have filters applied. After the optimal execution order is decided, subqueries are passed to QueryRunner for execution. When the query involves a data set that is partitioned, QueryRunner will create one QueryRunnerThread for each partition to maximize the query performance by concurrently executing independent queries. Query results are streamed to OutputStream as they are produced from any of the QueryRunnerThreads.
Queries across multiple data sets can be executed as either a union or as an intersection, depending on the portal configuration. In an intersection, the order in which subqueries are executed and joined can have a significant impact on performance, so the software attempts to predict the most efficient execution path. A further optimization for intersections is the optional use of data link indexes, whereby entries are checked against a pre-computed index file. Entries that will not return results are discarded earlier in the process, making downstream subqueries smaller and more efficient.
At this point, the subqueries are used to compile the queries that will be sent to the data sources, which can either be database servers or other BioMart servers. In the case of a database source, the compilation process determines the most efficient series of table joins to retrieve the requested data and creates an SQL statement. If the data source is accessed through another BioMart server, then the query engine generates a subquery in XML format and sends it via a web service call to the other BioMart server for processing and querying.
Subqueries are executed in the order determined by the planning step. When querying against partitioned data sets, independent queries are executed concurrently. The system retrieves results from the sources in batches, the size of which are configurable to best utilize the memory of different hardware configurations. Results are streamed from the data sources as they are retrieved in order to improve the speed at which results are returned and to control memory use. To further optimize BioMart’s memory use, results are synchronously written to the results buffer, so that less temporary storage is utilized by the BioMart server. The results from various sources are compiled and joined in-memory on the BioMart server for fast performance. As the data are compiled, they are synchronously output so that the client begins receiving results as quickly as possible.
Plugins
The BioMart system is extendable via a plugin architecture. This open architecture allows third-party developed software modules to interact with the system at different tiers. A plugin can be a browser-client module that implements a new web interface, a server-side module that further processes query results to produce a new visualization such as a bar chart or it can consist of both client-side and server-side components that work together to carry out complex data operations, such as a gene sequence retrieval tool.
Plugins must conform to a pre-defined interface and, once written, can be installed by simply putting it in the plugin directory. The BioMart configuration tool gives administrators access to all available plugins, and allows plugins to be added and configured in a BioMart Portal.
BioMart’s plugin architecture allows external developers to contribute to the project without having to modify the core BioMart code. These contributions can then be shared with the entire BioMart community.
Security
BioMart supports several security features for protecting sensitive data. A BioMart Portal can be configured to communicate with its clients (both users and other servers) via the HTTPS protocol, ensuring that protected data cannot be intercepted.
BioMart supports end user authentication via the OpenID protocol (9). Access control is managed by assigning users to user groups. Data set visibility can be configured for each user group, thereby allowing access to be restricted as necessary. By default, there is an ‘anonymous’ user group that determines which data sets are available to users who are not logged in (i.e. which data is publicly available). To ensure proper authentication in scenarios where OpenID cannot be used, such as when querying via APIs, the OAuth protocol (10) is used instead for authenticating the client.
Secure communication between BioMart servers is an essential part of the BioMart data federation. The OAuth protocol is used to ensure a BioMart server will only connect to pre-selected trusted partners. To enable this, a BioMart Portal administrator must exchange secure tokens with trusted BioMart server partners in a one-time configuration process, which eliminates the possibility of a BioMart server establishing a connection with an unknown third party.
Configuration and deployment
BioMart provides MartConfigurator (Figure 6), a tool for setting up, configuring and managing a BioMart Portal. MartConfigurator manages all the metadata including information about how data sources are structured, related to each other and presented to end users. It also makes it possible to restrict access to certain data to privileged users. The configuration is a step-wise process described below.
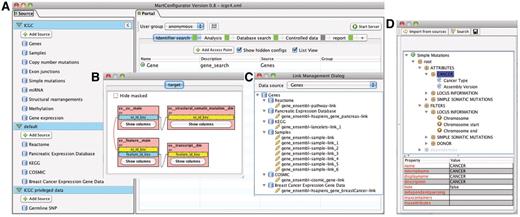
MartConfigurator. (A) The main MartConfigurator window is divided into two panels. Data sources are listed on the left. Data portal access points are listed on the right and are organized by types. (B) The Schema Editor window, showing the reverse star schema of a data set. (C) The Link Management window, showing the data links between data sources. (D) The Access Point Editor window, showing attributes and filters organized in containers.
Adding a data source
A data source can be a database in 3NF relational format, a database containing BioMart data sets in the reverse star schema format, or an existing BioMart data source available via web service from another BioMart Portal. When adding a 3NF relational database, MartConfigurator will assist the administrator in transforming the original schema into a reverse star schema using the algorithm described in the database section. The administrator starts by choosing one or more tables from the source 3NF schema that will form the backbone of the data set to be created, and the data set is created automatically. MartConfigurator also allows modification of the source schema in certain ways, such as adding and removing keys for adjusting relations between tables. These modifications may alter the way in which the transformation is performed, but they do not affect the source schema at the database level. At this point, a new data set is a non-materialized view over the existing 3NF schema and can be further modified by masking tables or individual columns. The administrator may choose to stop at this point and use the non-materialized data set to further configure the system. Alternatively, he or she can choose to materialize it for better query performance. This process will create new physical tables in the database containing the materialized data.
Configuring access points
Data access points provide graphical or programmatic ways of interacting with the data in the BioMart Portal. For a given data set, the administrator chooses which table columns to expose to the users as attributes and/or filters. Filters and attributes can also be imported from another data set if the two data sets can be linked through a common key. For instance, in an access point for a gene annotation data set, a pathway filter can be imported from a pathway data set as long as both data sets share a common data element, such as Entrez gene ID. With this imported filter, users can retrieve genes that are involved in user-specified pathway(s).
Once attributes and filters are created and organized, the administrator can choose to expose them using one or more of the built-in web or programmatic user interfaces. After access points are created, the administrator can grant data access to certain user groups. This allows control over which users have access to which data sets and can even control access to specific parts of a data set. Finally, the administrator can determine the layout of the home page, organizing how the various data sources and views are presented to the user upon initially loading the web portal.
Deploying the BioMart Portal
The BioMart server can be deployed directly from MartConfigurator using the ‘Start/Stop server’ button, which immediately launches an instance of the BioMart server on the workstation where MartConfigurator is running. A browser window will open and point to the BioMart web application, allowing the administrator to see exactly how the final deployment will appear to users. This instance is fully functional and can be queried in the same way as any other BioMart instance. The BioMart Portal configuration can be saved as an XML file for future deployment. In the production environment, the administrator can use a command-line script to start and stop the BioMart server. Several advanced options are available when the server is started from the command line, such as enabling secure access via HTTPS and configuring password protection for the entire server.
Data access
BioMart offers a variety of different graphical and programmatic interfaces for accessing data. The basic concepts underlying each interface are very similar and involve choosing data sets, filters and attributes. In the following section, we will demonstrate how the same query can be issued using different BioMart interfaces.
GUIs
BioMart offers several graphical querying interfaces appropriate for a variety of situations, spanning a range between simple, easy-to-use querying and more advanced, highly flexible querying. Regardless of the GUI type, the interaction is similar: the user first selects a data set or data sets to search, and then selects filters to restrict the data, if desired. Next, depending on the interface, the user may select attributes to be returned by the query. The user then presses the ‘Go’ or ‘Results’ button and results are immediately returned. Results may also optionally be downloaded at this point. Examples of the same query compiled using the ‘MartForm’, ‘MartWizard’ and ‘MartExplorer’ GUIs are shown in Figure 7 A–C, respectively.
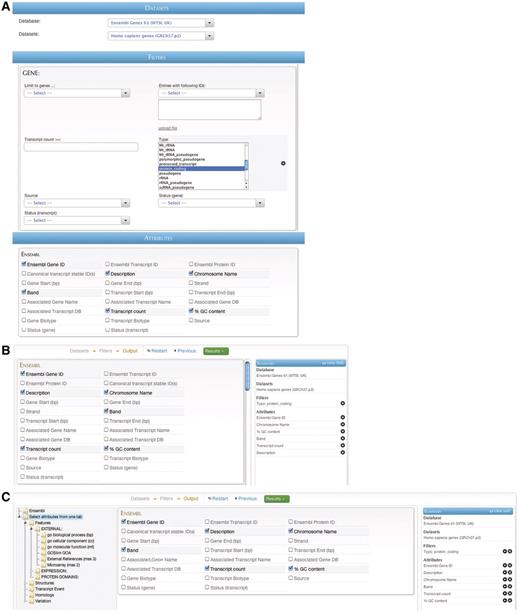
BioMart web GUIs: ‘MartForm’, ‘MartWizard’ and ‘MartExplorer’. (A) ‘MartForm’ presents, from top to bottom, a choice of data sets, filters and attributes. Filters and attributes may be organized in containers and subcontainers, and mutually exclusive sets of filters and attributes can be segregated into separate tabs. MartForm presents all options on a single page, and so is most appropriate for queries that require user-configurability, but that have a relatively small number of filters and attributes. (B) For searches with a larger number of filters and attributes, there is the ‘MartWizard’ interface. In the ‘MartWizard’ interface, data sets, filters and attributes are chosen in successive steps, each step presented on its own page. The query is summarized in the right-hand column as it is being built, and users can move between the filter and attribute pages to modify the query. Within each page, filters and attributes can be presented in containers and as in ‘MartForm’. (C) For maximum flexibility and complex querying, there is the ‘MartExplorer’ interface. As in ‘MartWizard’, in ‘MartExplorer’ data sets, filters and attributes are presented on separate pages. However, instead of being organized into containers on a single page, in ‘MartExplorer’, filters and attributes are organized into a hierarchical folder structure presented in the left-hand column on the screen. As such, ‘MartExplorer’ is most appropriate for queries with a large number of filters and attributes that are organized in a complex directory structure.
Application programming interfaces
In addition to the GUIs, BioMart provides a range of different Application programming interfaces (APIs) for programmatic access. These include REST and SOAP web service APIs, a Java API and SPARQL endpoints for semantic queries. As with the graphical interfaces, interrogating the portal through the programmatic interfaces involves choosing a data set or data sets, filters and attributes. This is reflected in the similarity of the syntaxes of the various APIs as shown below.
REST/SOAP
<Query client=“true” processor=“TSV” limit=“-1” header=“1”>
<Dataset name=“hsapiens_gene_ensembl”>
<Filter name=“biotype” value=“protein_coding”/>
<Attribute name=“ensembl_gene_id”/>
<Attribute name=“ensembl_transcript_id”/>
<Attribute name=“description”/>
<Attribute name=“band”/>
<Attribute name=“percentage_gc_content”/>
<Attribute name=“transcript_count”/>
</Dataset>
</Query>
JAVA
Query.Dataset ds = query.addDataset(“hsapiens_gene_ensembl”);
ds.addFilter ("biotype", "protein_coding");
ds.addAttribute ("ensembl_gene_id");
ds.addAttribute("ensembl_transcript_id");
ds.addAttribute ("description");
ds.addAttribute("band");
ds.addAttribute ("percentage_gc_content");
ds.addAttribute ("transcript_count");
SPARQL
SELECT ?ensembl_gene_id ?ensembl_transcript_id ?description ?band ?percentage_gc_content ?transcript_count
FROM dataset:hsapiens_gene_ensembl
WHERE {
?x attribute:biotype "protein_coding".
?x attribute:ensembl_gene_id ?ensembl_gene_id.
?x attribute:ensembl_transcript_id ?ensembl_transcript_ id.
?x attribute:description?description.
?x attribute:band ?band.
?x attribute:percentage_gc_content ?percentage_gc_content.
?x attribute:transcript_count ?transcript_count
}
It is also possible to set additional parameters in the queries so that the results can be returned according to user input. The parameters include: limit (rows to be returned), header (to include column headers or not), processor (pre-defined ways of processing results before sending back to users, this usually is for generating the result in different formats) and others.
Scripting at t he click of a button
Queries can be constructed in the GUI and then converted to one of the API formats by clicking on the appropriate button on the results page (Figure 8). As the same abstractions of attributes, filters and data sets are used by all query types (including the GUI), it is simple to interconvert between them.
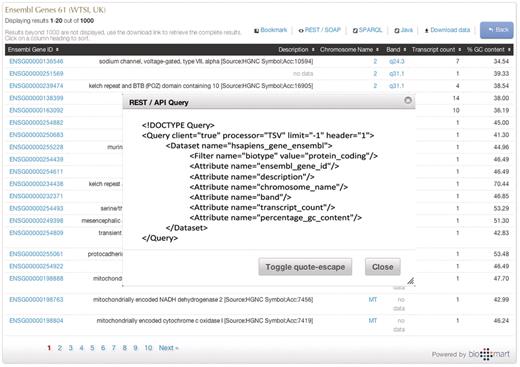
Programmatic access with a click of a button. By clicking one of the available API buttons such as REST/SOAP web service, SPARQL or Java, a query that has been constructed in a web-based GUI is automatically compiled to the desired syntax.
Additional GUI types
In addition to the querying GUIs, BioMart comes pre-installed with two special GUI types. The first of these is the ‘MartReport’ (Figure 9). The ‘MartReport’ interface displays many attributes linked to a data entry via a single identifier, so that a large amount of related data can be presented in an integrated report page. Data from different sources can be integrated in a report through the BioMart data federation mechanism. It is designed to integrate with BioMart’s ability to associate a hyperlink with an attribute, so that administrators can allow users to bring up a report page by clicking on a specific identifier from other search results.
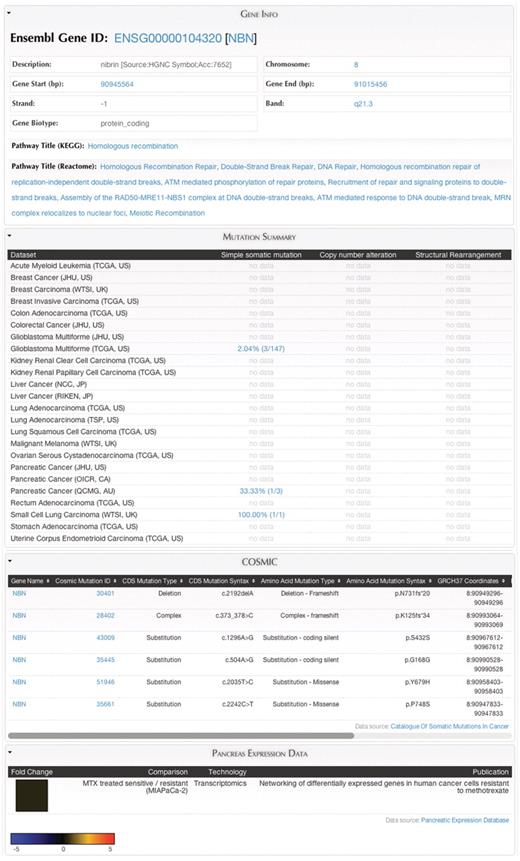
MartReport. ‘MartReport’ presents detailed information about a single data entry such as a cancer sample, a gene or a point mutation. MartReport allows data from multiple data sources to be presented in a single report page. In this example, data about the NBN gene are retrieved and integrated from Ensembl, KEGG, Reactome, ICGC, COSMIC and the Pancreatic Expression Database.
The second special GUI type is ‘MartAnalysis’, which allows the results of a query to be processed and presented in different ways through the BioMart plugin framework. A few plugins have been included in the core BioMart distribution, such as a bar graph and a genomic sequence retrieval tool. Figure 10 shows the most frequently affected pathways, presented as a bar graph using the ‘MartAnalysis’ GUI.
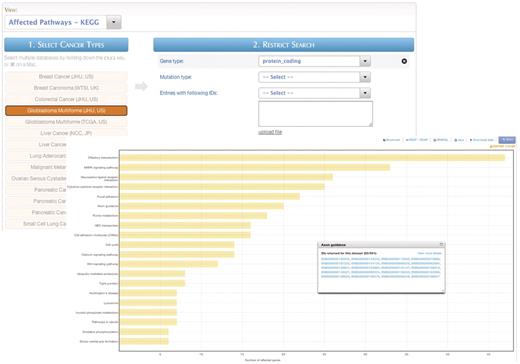
MartAnalysis. ‘MartAnalysis’ presents the user with a choice of data sets in a column on the left and a list of filters in a column on the right. The attributes are determined in advance by the administrator and cannot be changed by the user. As such, the ‘MartAnalysis’ interface is best suited for quick querying of commonly used attributes. In this example, the query result is processed to produce a histogram presentation of the most frequently affected pathways.
Programmatic access to metadata
In order to allow users and third-party tools to explore the available data sets, filters and attributes, BioMart offers methods for retrieving metadata via the REST/SOAP web service and Java APIs. The metadata retrieval syntax is similar across different APIs, as shown in the following examples:
| Metadata to retrieve . | API . | Method . |
|---|---|---|
| Data sources | REST/SOAP | /martservice/datasources |
| Java | getDataSources() | |
| Data sets | REST/SOAP | /martservice/datasets?datasource=datasourcename |
| Java | getDatasets(datasourcename) | |
| Filters | REST/SOAP | /martservice/filters?datasets=datasetname |
| Java | getFilters(datasetname) | |
| Attributes | REST/SOAP | /martservice/attributes?datasets=datasetname |
| Java | getAttributes(datasetname) |
For SPARQL semantic querying, metadata (including filters and attributes) is expressed through an ontology as an RDF/XML document that can be retrieved from the SPARQL endpoints. For example, ontology information about hsapiens_gene_ensembl data set can be retrieved from: /martsemantics/hsapiens_gene_ensembl/ontology. The ontology document can be opened and explored via GUI in OWL ontology tools such as SWOOP(11), OwlSight (12) and Protégé (13).
Future directions
BioMart software has been successfully adopted in more than 30 public biological databases containing a range of data types, including gene annotation [Ensembl (14), HGNC (15)], genome variation [HapMap (16)], protein sequence and structure [InterPro (17), PepSeeker (18), PRIDE (19), UniProt (20)], molecule interaction and biological pathway [Reactome (21)], gene expression [EMAGE (22), Eurexpress (23), GermOnline (24), SigReannot (25)], cancer genome [COSMIC mart (26), Pancreatic Expression Database (27), IntOGen (28)] and model organism [Gramene (29), MGI (30), Paramecium DB (31), WormBase (32)]. The International Cancer Genome Consortium (ICGC) has utilized the latest version of BioMart to build a data portal (33) for managing a huge amount of cancer genomics data produced and residing all around the globe. The new version of BioMart Central Portal (34) also takes advantage of the new BioMart software, integrating over 30 independently maintained public databases into a single point of access.
The BioMart system is continuously being improved, and as such several new features are under development. In order to improve coordination between BioMart servers, we are creating the BioMart Central Registry. This will be a permanent resource where BioMart data providers can register their data models and data sources. The Central Registry will allow anyone to explore the available BioMart servers. Links between independent data sources will be stored in the Registry, allowing server deployers to easily find new sources of potential annotations. Moreover, as a centralized, permanent resource, the Central Registry can reliably be used to coordinate the creation of large data portals: changes in independently administered data sources can be tracked and synchronized via the Registry.
To further the flexibility of BioMart, we are adding support for automatically building BioMart databases from non-RDBMS data sources, such as flat data files or XML data files. BioMart will allow administrators to create a data model for the source data, and the BioMart data loading module will then transform the data into a BioMart schema using the same algorithm that is used for transforming relational data sources.
One of the major avenues for the continued development of BioMart is the robust plugin system. We plan on enhancing the BioMart system with the addition of plugins allowing various forms of data visualization directly in the BioMart GUI. Of course, third parties may also develop plugins, further extending the capabilities of the system.
Funding
Funding for open access charge: Ontario Institute for Cancer Research and the Ontario Ministry for Research and Innovation.
Conflict of interest. None declared.


