-
PDF
- Split View
-
Views
-
Cite
Cite
Lee S. Katz, Jay C. Humphrey, Andrew B. Conley, Viswateja Nelakuditi, Andrey O. Kislyuk, Sonia Agrawal, Pushkala Jayaraman, Brian H. Harcourt, Melissa A. Olsen-Rasmussen, Michael Frace, Nitya V. Sharma, Leonard W. Mayer, I. King Jordan, Neisseria Base: a comparative genomics database for Neisseria meningitidis, Database, Volume 2011, 2011, bar035, https://doi.org/10.1093/database/bar035
Close - Share Icon Share
Abstract
Neisseria meningitidis is an important pathogen, causing life-threatening diseases including meningitis, septicemia and in some cases pneumonia. Genomic studies hold great promise for N. meningitidis research, but substantial database resources are needed to deal with the wealth of information that comes with completely sequenced and annotated genomes. To address this need, we developed Neisseria Base (NBase), a comparative genomics database and genome browser that houses and displays publicly available N. meningitidis genomes. In addition to existing N. meningitidis genome sequences, we sequenced and annotated 19 new genomes using 454 pyrosequencing and the CG-Pipeline genome analysis tool. In total, NBase hosts 27 complete N. meningitidis genome sequences along with their associated annotations. The NBase platform is designed to be scalable, via the underlying database schema and modular code architecture, such that it can readily incorporate new genomes and their associated annotations. The front page of NBase provides user access to these genomes through searching, browsing and downloading. NBase search utility includes BLAST-based sequence similarity searches along with a variety of semantic search options. All genomes can be browsed using a modified version of the GBrowse platform, and a plethora of information on each gene can be viewed using a customized details page. NBase also has a whole-genome comparison tool that yields single-nucleotide polymorphism differences between two user-defined groups of genomes. Using the virulent ST-11 lineage as an example, we demonstrate how this comparative genomics utility can be used to identify novel genomic markers for molecular profiling of N. meningitidis.
Database URL:http://nbase.biology.gatech.edu
Introduction
Meningococcal disease
Neisseria meningitidis is a Gram-negative encapsulated bacterium that is a leading cause of bacterial meningitis worldwide (1). Case fatality ratios for meningococcal disease are 10–14%, and an additional 11–19% of survivors have long-term neurological sequelae such as deafness and mental retardation (2). Understanding the genomics of circulating strains is needed to understand the population biology of N. meningitidis. For example, a recent database called BIGSdb takes advantage of loci across the meningococcal genome to produce customizable molecular profiles (3). These profiles reveal high-quality resolution typing data. Our needs include searching whole genomes for genomic determinants for phenotypic differences between isolates. To meet these needs, the Meningitis Laboratory at the Centers for Disease Control and Prevention (CDC) has adopted a genomics approach to the study of N. meningitidis.
Genomics and bioinformatics for N. meningitidis
A number of efforts are underway to characterize N. meningitidis genome sequences, and the amount of genomic data for this organism will increase exponentially in the near future. CDC recently used next-generation sequencing technology (4) to characterize 19 N. meningitidis genomes for the study of various characteristics including capsule switching. At the time of this writing, nine additional N. meningitidis genome sequences have been characterized elsewhere (5–12).
Bioinformatics tools that can handle these data and have the capacity to scale sufficiently to accommodate the anticipated rapid increase of N. meningitidis genome sequences are essential. Computational genomics applications that are accessible and useful to working biologists are also important. Our group has addressed one aspect of these challenges by developing a fully automated analytical pipeline that takes genome sequence data and sequentially performs genome assembly, gene prediction and functional annotation—the CG-pipeline (freely available at http://sourceforge.net/projects/cg-pipeline/) (6). The pipeline allows investigators to gain rapid access to annotations for individual N. meningitidis genomes without laborious manual analysis. However, once such data are in hand, researchers will still need a way to visualize the information and to compare annotation data and sequences among different genomes. It also will be critical to develop and maintain a shared platform for the storage and dissemination of the data and results generated by the N. meningitidis genome projects. To address these aims, we have developed Neisseria Base (NBase), an online platform for the storage, dissemination and comparative analysis of N. meningitidis genomes characterized at CDC and elsewhere. NBase allows users to browse, search and download genome sequences and annotations for N. meningitidis. The database also includes comparative genome analysis applications including the SNPtool that allows users to discover individual nucleotide variations that distinguish between two user-selected groups of N. meningitidis genomes. We provide an example of a whole genome comparison in this article. The NBase platform is designed to be scalable so that it can readily incorporate scores of new genomes and their associated annotations. NBase is a freely available community resource and can be found at http://nbase.biology.gatech.edu.
Materials and methods
Genomic data
A total of 19 N. meningitidis genomic sequences were characterized using 454 pyrosequencing at CDC’s Biotechnology Core Facility Branch and analyzed at the Georgia Institute of Technology. An additional nine N. meningitidis genomes that had been previously characterized are also included in NBase. Supplementary Table S1 shows a list of the genomes in NBase, along with metadata describing their origins. Genomic sequence data characterized at CDC were analyzed using the CG-Pipeline (versions 0.2.1–0.2.4) automated genome analysis platform.
During the assembly stage, the best reference genome assembly, or best de novo assembly, was chosen for further analysis. On the resulting assembly, we predicted gene locations using a combination of homology searches and ab initio methods. On those gene predictions, we performed automated functional annotation using a combined approach that includes 17 different annotation applications. The annotation step produces GenBank format flat files. These GenBank files are converted into general feature format (GFF) for import into NBase. Further details on the genome sequencing protocol and the genome-analysis procedures can be found in the report on the CG-Pipeline (6).
Software components
To construct NBase, we used several software components: GBrowse 2.00(13), BLAST version 2.2.17 (14), Perl 5.8.8, BioPerl 1.6.1. (15), Mauve 2.2.0 (16), MUSCLE 3.6 (17) and JalView 2.5.1 (18, 19). NBase rests on MySQL version 5.0 and is hosted using the Apache version 2.0 Web server application (http://mysql.com, http://apache.org).
Multiple sequence alignment
Whole-genome multiple sequence alignments (MSAs) were constructed from 27 genomes (Supplementary Table S1) by using the mauveAligner algorithm of the program MAUVE. The mauveAligner algorithm produces local alignments of co-linear orthologous regions, shared among all genomes, which are called local co-linear blocks (LCBs). Each individual LCB was aligned further by using the program MUSCLE, without using the refine option.
Determination of sequence types
For seven of the new genomes characterized here, sequence types (STs) were determined using the whole-genome sequence. To do this, whole genomes were compared against the PubMLST database (20) to find and perform allele calls for all seven loci. The only ambiguous sequence was adk from M16917, which was resequenced to confirm its identity. Otherwise, there were no novel alleles and no imperfect matches to the MLST loci for these genomes. For the remaining 12 genomes, STs were determined by conventional sequencing methods (21).
Comparison of ST-11 genomes against other genomes
The comparative genomics utility SNPtool evaluates a MSA of complete genome sequences to find individual single-nucleotide polymorphisms (SNPs) that discriminate two user-defined groups of genomes. SNPtool was used to compare ST-11 genome sequences (strains FAM18, M13519, M16917, M17661, M18774, M15141 and M9261) against 10 other complete genome sequences representing seven different STs: 32, 74, 4824, 198, 177, 53 and 7 (strains M13220, α14, M17094, M10699, M15293, M5178, MC58, 8013, M17062 and 053442). The genome sequence of the M13220 strain was used as a reference for this comparison, and the positions of SNPs that discriminate genomes between these two groups were given as coordinates on the M13220 genome. Ten individual SNPs shown to distinguish the ST-11 from the non-ST-11 genome groups using SNPtool were validated using sequences of MLST loci characterized by Sanger sequencing. The SNP validation analysis compared sequences from ten ST-11 strains to 10non-ST-11 strains representing the seven other STs compared with SNPtool.
Neisseria Base
Front page
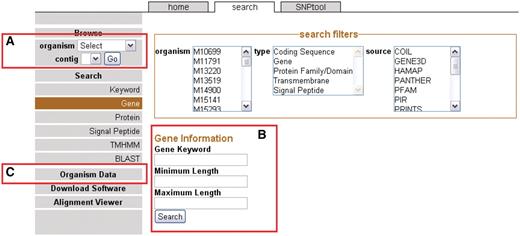
The NBase front page serves as the gateway to all of the data, tools and analytical capability housed in NBase. The front page of NBase is designed to be straightforward. The user can choose to do one of several things from the front page: (i) view metadata; (ii) download; (iii) browse; (iv) search; or (v) perform SNP analysis.
Metadata, the information about each genome, is located on the left navigation bar (Figure 1C). Information about each isolate, such as geographic origin, date isolated and profile information is shown in columns. Genomic data are available in the organism table to download in standard file formats (GenBank, FASTA and GFF). In addition, all software generated by this comprehensive project including the CG-Pipeline can be downloaded from the home page. On the Alignment Viewer page, the multiple sequence alignment of each LCB of all available genomes may be viewed by either reading the plain text in Clustal format or using the JalView applet (18, 19). JalView includes functions for generating phylogenetic trees on demand, which is useful for observing the similarity between strains in a specific region.

The front page sidebar. The sidebar provides access to the genome browser, search functions and metadata. (A) To browse, users can select a genome and a contig to proceed to the GBrowse interface. (B) To search, a user can supply a keyword or can choose to search via one of several search items. (C) Genomic metadata is available via the Organism Data link (Supplementary Table S1). A link is provided to the alignment data page.
Users can browse genomes by selecting the organism from the drop-down menu on the sidebar (Figure 1A). After a genome has been selected, available contigs or chromosomes are shown. Most 454 assemblies will not be complete because of coverage considerations (22) or repeat elements (23) and therefore most of the genomes on NBase are viewable on the contig level instead of a chromosomal level. After the contig or chromosome is chosen, the user is brought to the GBrowse (13) graphical interface (see ‘Genome browser’ section).
Another way to arrive at the GBrowse interface is to search for specific genomic features. In this case, genomic features are any annotated landmarks in a genome including genes and all associated annotations. Categories of searches are located on the sidebar on the Search page (Figure 1B). Search results may be filtered to selected organisms, feature types (e.g. genes) and/or annotation source. The annotation sources correspond to different annotation applications used in the CG-Pipeline genome analysis tool (6). Each specific type of search allows for the inclusion of more specific parameters such as gene length. If the user does not want to use a specific search, a general keyword search is provided. One additional way to search for genomic sequences is to use any one of the five BLAST programs in the BLAST interface. By clicking on the BLAST results, the user can arrive at the GBrowse interface.
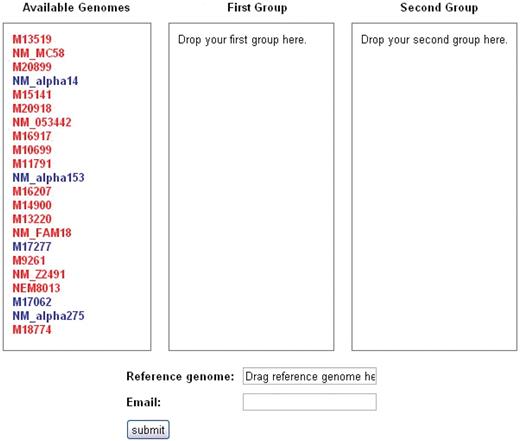
The user may navigate to the SNP analysis tool, called SNPtool, from the SNPtool tab at the top of the front page. SNPtool uses a comprehensive MSA to discover SNPs that show mutually exclusive patterns between two user-defined groups of genomes (Figure 2). Such SNPs serve as markers for discriminating between the two groups of genomes. To use SNPtool, a user drags desired genomes into the first or second group to define each group. Next, the user supplies a reference genome so that the results can be visualized in the GBrowse interface. The SNPtool outputs the coordinates of all discriminating SNPs, defined in the genome space of the reference genome, along with a list of genes associated with the discriminating SNPs. These SNP genes are defined as genes that have discriminating SNPs within their coding regions and/or within a user-defined region upstream and downstream of the predicted coding start/stop sites. All results from previous SNPtool selections are accessible by a hyperlink on the SNPtool page, and the user can view selected results in the Genome browser section.

SNPtool. The SNPtool finds discriminating SNPs between two groups of genomes. Each group is defined by the user, by dragging each genome to a designated group. Not all genomes must be used. A reference genome must be designated, as the results can be viewed on the graphical genome browser from the vantage point of the chosen reference genome. Invasive isolates are designated by red, carriage by blue.
Genome browser
We chose to use GBrowse because it is customizable, open-source, fast and reliable (13). It is also a proven genome browser used by several institutions for several other organisms, and so many users are familiar with the interface (24–26) (GMOD Users, http://gmod.org/wiki/GMOD_Users). We implemented GBrowse with a MySQL database using the GFF schema. We were able to use this schema unmodified to store multiple-genome annotations in a single database and quickly load the feature annotations with GBrowse. Use of this approach also facilitates scalability with respect to rapid and facile assimilation of new genome sequences and annotations.
NBase is also designed to be scalable with respect to the addition of new applications. This has been achieved via the formatting of the database schema that underlies GBrowse. Currently, all of our search utilities, both text- and sequence-based, query the same MySQL database on which GBrowse runs. When any new applications are added to the site, they will be designed to query the same database with little or no modification to the schema. Furthermore, the entire source for the browser and associated utilities has a modular design to facilitate future additions to the site.
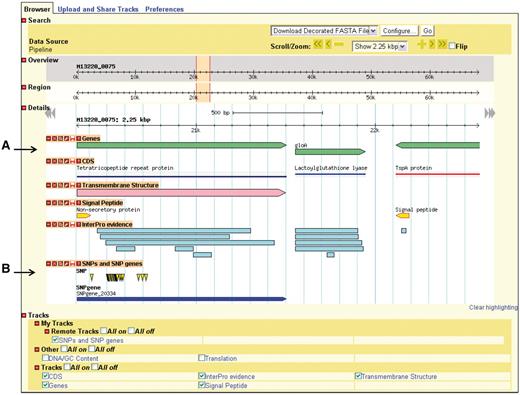
GBrowse gives the user a linear map of a selected region of a genome with the genomic features appearing at their respective coordinates (Figure 3). The user can zoom in and out, move upstream and downstream along the sequence, and configure the display of sequence features. GBrowse uses semantic viewing, which refers to how much detail is shown when the depiction is zoomed in or zoomed out. From a distance, features are shown only as colored arrows that show directionality. At a medium zoom, features’ names are visible. At a closer view, individual nucleotides and amino acid residues can be seen.

Genome depiction. The genome is represented linearly, with features on their respective coordinates. (A) Genes and their coding sequences (CDS) each have their own track and are links to their own details page. (B) Uploaded tracks.
Genes, nucleotides and residues can be viewed only if their respective tracks have been turned on. Additionally users can supply their own custom tracks to overlay and compare features, using the correct file format (Supplementary Figure S1). One example of adding custom tracks is using the results from the SNPtool. The results of the SNPtool, the lists of discriminating SNPs and SNP genes, can be uploaded to NBase and compared with other tracks (Figure 3).
Details page
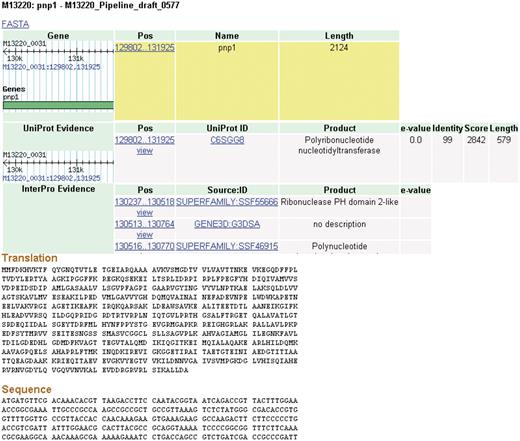
Clicking on a feature brings the user to a details page (Figure 4). Each feature inherently has some fundamental characteristics that will be displayed such as name, length and coordinates. A wealth of additional information is also available for data that are produced by the CG-Pipeline or that are already present in imported genomes. The CG-Pipeline annotates genes using the UniProt database (27) and InterProScan (28). In addition, it predicts transmembrane helices with TMHMM (29), signal peptides with SignalP (30) and virulence genes with the virulence factors database (31,32). All of these annotations are present in NBase. The details page includes hyperlinks to the online UniProt and InterProScan databases from which the annotations are derived.

Details page. The details for some features of a coding sequence are shown. Up to five overlapping feature types may appear: gene, protein, protein domain, signal peptide and transmembrane structure. The target feature is highlighted in yellow. The nucleotide and amino acid sequences for this feature appear at the bottom of the page. All features on the page include links to their coordinates in GBrowse genome viewer.
Genome-scale typing using SNPtool
Here, we illustrate the potential application of NBase, and the comparative genomics utility encoded therein, to molecular profiling and subtyping of N. meningitidis. Current typing protocols, such as MLST (21), are based on suites of individual markers or alleles. In MLST, seven predefined loci are sequenced, and their alleles are called to produce a profile called a ST. At the time of this writing, several hundred alleles are defined per locus, and >8500 STs are defined (20). While this approach is powerful, genome-scale-comparative analyses should be able to provide even greater resolution for typing. Here, we illustrate how SNPtool can be used to facilitate the discovery of novel markers that define a well-known virulent lineage of N. meningitidis.
ST 11
Neisseria meningitidisST-11 has been associated with disease more than any other ST (33–35). We evaluated the utility of SNPtool for the discovery of novel genomic markers that characterize the hypervirulent ST-11 lineage. To do this, we compared the complete ST-11 meningococcal genomes in NBase against 10 other N. meningitidis genome sequences therein representing a diverse set of seven other STs. Comparison of these two sets of genomes with SNPtool yielded 7822 SNPs that show mutually exclusive patterns between ST-11 genomes and the seven other STs evaluated. All of these sites represent possible markers for ST-11, which by definition could differentiate ST-11 from other STs, thus providing increased resolution for subtyping. We validated ten of these SNPs using sequences of MLST loci, and found that each of the validated positions unambiguously distinguishes ST-11 genomes from the seven other STs evaluated (Supplementary Table S2). These results serve as a proof-of-principle showing that SNPtool is able to identify numerous differences between groups of genomes at the level of individual nucleotide variation, each of which can serve as a potential lineage-specific marker. It should be noted that SNPtool is conservative in the sense that it relies on aligned regions that are shared among all genomes in NBase; smaller groups of genomes may have additional discriminating SNPs outside of these conserved regions.
Discussion
There are currently several other neisserial databases available (36–40). Other Neisseria genome browsers have notable strengths, particularly NeMeSys (11), which provides very useful tools, provides a syntenic perspective when viewing genomes, and contains mutagenesis studies for genome 8013 (41). NBase has been designed specifically to readily accommodate new genomes that are analyzed by using the CG-Pipeline, which is open source and can run locally on a desktop computer.
Using only open-source software has many advantages. First, many users are familiar with the GBrowse interface, thus reducing the amount of time it takes to learn how to use and navigate through NBase. Second, all new plugins for GBrowse are readily incorporated into NBase as needed (e.g. a plugin to download a selected region of a genome). Third, all existing software belonging to the Generic Model Organism Database project (GMOD) can be assimilated into NBase. For example in the future, we will incorporate into NBase GMOD’s SynView, which is a synteny viewer for GBrowse (42). SynView is a comparative genomics tool that displays visualizations of MSAs. It will allow researchers to visualize and compare homologous regions across genomes.
NBase allows searching, browsing and downloading of whole genomes, including assemblies and annotations. In total, we have 27 meningococcal genomes available for these tasks. At NBase’s core is GBrowse, which has a simple yet advanced database structure that has a graphical interface for browsing genomes. GBrowse also facilitates the usage of a details page for each feature in a genome so that a user sees both the breadth and depth of a genome. Finally, NBase is distinguished by its comparative genomics utility. Here, we have demonstrated the flexibility and scalability of NBase by incorporating a custom comparative genomics tool, SNPtool. The SNPtool compares two groups of genomes and displays discriminating SNPs and their associated SNP genes. We have demonstrated that the SNPtool can be used to compare whole groups of isolates on a genomic level to uncover individually significant SNPs. This has been useful for uncovering genomic markers for ST-11.
Funding
Centers for Disease Control and Prevention (1 R36 GD000075-1 to L.S.K.); Alfred P. Sloan Research Fellowship in Computational and Evolutionary Molecular Biology (BR-4839 to I.K.J.); Georgia Research Alliance (GRA.VAC09.O to I.K.J., B.H.H., L.W.M. and L.S.K.]; Bioinformatics program, Georgia Institute of Technology [to J.C.H., P.J., N.V.S., V.N.); Defense Advanced Research Projects Agency (HR0011-05-1-0057 to A.O.K.). Funding for open access charge: Bioinformatics program, Georgia Institute of Technology.
Conflict of interest. None declared.
Acknowledgements
We would like to thank Elizabeth Neuhaus, Dhwani Govil and Scott Sammons from the Biotechnology Core Facility Branchwho helped guide us. Thank you to Scott Cain who originally demonstrated the GBrowse platform to us. Thank you to the 2008–2010 Compgenomics classes at The Georgia Institute of Technology. Thank you to Nancy Messonnier for reviewing this article and providing valuable feedback. Many individuals donated strains for research including those from the Active Bacterial Core Surveillance program. We would like to thank the hard work of those who donated the following isolates for research: M20918, M13220, M18575, M17277, M16207, M17094, M10699, M5178, M15141, M17062, M15293, M16917, M13159, M17661, M18774, M9261, M11791, M14900 and M20899.


