


Abstract
The Aspergillus flavus expression database (AFED) is a comprehensive resource dedicated to exploring gene expression in A. flavus, a significant fungal pathogen that threatens food security by contaminating crops with aflatoxin. Given the complex regulation of aflatoxin biosynthesis and the lack of centralized expression data resources for this important pathogen, a database integrating diverse experimental conditions is essential for understanding its biology and developing control strategies. Public RNA sequencing data were used to quantify gene expression abundance for 604 A. flavus samples from 52 experiments. Using abundance data, we created an AFED accessible through a web-based interface that allows for the expression profiles of genes to be conveniently examined across different growth conditions and life cycle stages. Expression profiles can be visualized through either an interactive bar plot for single gene queries or a heatmap for multiple gene queries. A gene co-expression network based on samples containing at least 10 million mapped reads is also available, which allows users to identify genes that are co-expressed with an individual gene or set of genes and displays the functional enrichment among the co-expressed genes.
Database URL: https://a-flavus-expression-db-jyqnpeuvta-uc.a.run.app
Introduction
Aspergillus flavus is an opportunistic fungal pathogen that infects critical food and feed crops, particularly corn. Aspergillus flavus produces aflatoxins, acutely toxic and highly carcinogenic compounds that target liver cells, which can contaminate food and feed [1]. Aflatoxins in the food supply pose a serious threat to human health [2] as they are presumed responsible for between 5% and 30% of all hepatocellular cancer cases worldwide [3]. Additionally, potential economic losses due to aflatoxin contamination of corn can exceed $1.5 billion annually in the USA [4]. Aflatoxin is biosynthesized by a large biosynthetic gene cluster (30 genes) through the action of many complicated regulatory mechanisms [5]. Understanding the molecular mechanisms underlying A. flavus pathogenesis and aflatoxin production is crucial for developing effective strategies to control its spread, minimize crop losses, and prevent adverse health events. Transcriptomic analysis is a powerful tool to dissect molecular mechanisms and discover new regulatory pathways.
While several resources exist for exploring transcriptomic data in fungi, such as FungiExp [6], FungiDB [7], and EBI Expression Atlas [8], a comprehensive database dedicated solely to the globally detrimental fungus A. flavus is currently lacking. Given the significant impact A. flavus has on agriculture as a major crop pathogen and mycotoxin producer, a specialized database for this organism is warranted. The A. flavus expression database (AFED), reported herein, fills this gap with a highly intuitive and user-friendly interface that sets it apart from existing tools. It uniquely provides a searchable co-expression network for A. flavus not present in other available resources and a simple interactive heatmap tool with a flexible annotation-based way of selecting genes for visualization.
RNA sequencing (RNA-seq) provides both transcript abundance data and precise location of transcript boundaries. However, publications reporting RNA-seq datasets rarely publish the processed gene expression values. The raw reads are generally submitted to the Sequence Read Archive (SRA) necessitating the time-consuming steps of read mapping, quantification, and normalization to obtain expression values. AFED saves time and effort by allowing researchers investigating A. flavus to effortlessly obtain the expression values of specific genes from any A. flavus RNA-seq dataset in National Center for Biotechnology Information (NCBI). The included genome browser allows users to visualize the coverage of the RNA-seq reads alongside the predicted gene structures to verify the structures of their genes. Additionally, the co-expression network derived from this data provides a valuable tool for researchers to infer potential functions for their genes of interest. Furthermore, the database will be updated annually to incorporate new A. flavus RNA-seq data deposited in NCBI’s SRA.
Database content and usage
AFED encompasses 604 samples cultivated from diverse growth conditions, including 14 distinct media (e.g. corn, peanut, and various agar-based formulations), time points ranging from 6 h to 7 days, as well as studies involving gene mutants, chemical treatments, and environmental variations. The interface provides five tools to compare and evaluate RNA-seq gene expression data across samples, experiments, and bioprojects (Fig. 1). The bar plot tool (Fig. 1a) allows users to search for an individual gene and visualize the expression levels of the gene across all samples in the database. Because technical biases are possible between different projects due to the sequencing methods used as well as RNA integrity [9], the samples are grouped and coloured by projects. Hovering the mouse over each bar displays the sample’s metadata such as strain, growth medium, or treatment, whereas clicking on a bar shows all the metadata of the sample below the plot. The expression values that are initially displayed default to transcripts per million (TPM) but can be changed to a log scale by selecting the variance stabilized transformed (VST) counts. All samples are displayed by default but can be limited to samples from specific bioprojects or growth mediums. The bar plot tool and the other tools available in AFED allow for analysis using either of two A. flavus NRRL 3357 genome assemblies: an older assembly that has been frequently referenced in the literature (GCA_000006275.2) or a newer chromosome level assembly (GCA_009017415.1). A spreadsheet containing the expression values alongside the sample metadata can be downloaded.
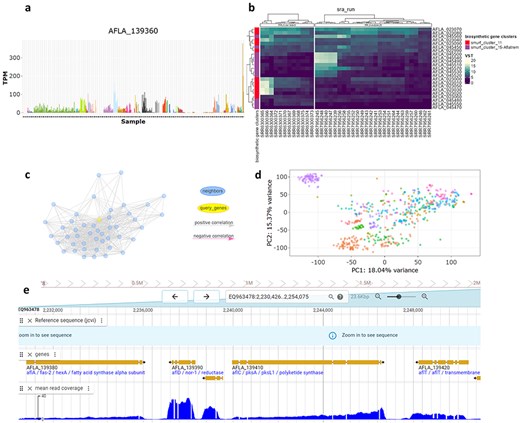
The AFED interface provides five tools utilizing NCBI RNA-seq data. (a) Bar plot tool showing TPM or VST expression values across all samples for a single gene. (b) Heatmap tool of specific genes and samples from selected bioprojects. (c) Co-expression network visualization of selected genes and their neighbours. (d) PCA biplot of samples coloured by chosen metadata category. (e) Genome browser showing the mean read coverage across all samples.
The heatmap tool (Fig. 1b) allows users to input a list of genes or select genes from the available functional annotation categories and view the expression values in a heatmap with hierarchically clustered rows and columns. The samples included in the heatmap are chosen by selecting bioprojects or by growth mediums, and samples will be displayed in separate groups by bioprojects within the heatmap. If genes are chosen through the functional annotation option, the left side of the heatmap will have a colour tile indicating the annotation terms the genes belong to. The expression values for the displayed genes or all the genes can be downloaded as a spreadsheet through the buttons on the bottom left.
The co-expression network tool (Fig. 1c) allows users to see the first-order neighbours of a gene or genes of interest using the same gene selection method as the heatmap tool. The nodes of the neighbours are coloured blue, and the selected genes will be coloured according to their functional annotation term. The edges connecting nodes are coloured grey and pink for positive and negative correlations, respectively. An option to disable the neighbour lookup is available for users who wanted to examine co-expression relationships between a set of predefined genes. The genes in the displayed subnetwork can then be tested for functional enrichment. The enrichment results, edge weights, and functional annotation of the genes in the subnetwork can all be downloaded as an Excel spreadsheet. The edge weights can easily be imported into external tools such as Cytoscape for further manipulation and visualization.
The principal component analysis (PCA) tool (Fig. 1d) shows the results of a PCA using the VST counts and allows the user to explore the interrelations among the samples. Additional principal components can be shown using the dropdown menu. Sample metadata is available by hovering or clicking. Samples can be coloured by bioproject, growth media, or fungal strain.
Finally, the genome browser tool (Fig. 1e) provides a searchable gene track alongside an RNA-seq coverage track, which shows the mean coverage of all the samples. Examining the coverage of a gene can help to evaluate the accuracy of a gene’s prediction.
Materials and methods
Quantification of gene expression
The workflow is summarized in Fig. 2. The rentrez R package [10] (version 1.2.3) was utilized to identify A. flavus RNA-seq datasets on NCBI’s SRA and to download the associated metadata. The sequencing reads were then downloaded using Kingfisher [11] (version 0.4.1) and trimmed of adapter sequences and low-quality bases using fastp [12] (version 0.23.2). Reads were aligned using STAR [13] (version 2.7.10b) to two A. flavus genomes, GCA_000006275.2 and GCA_009017415.1, separately. Read counts were acquired using STAR with ‘--quantMode GeneCounts’. Quality assessment of the mapped reads was performed using Picard CollectRnaSeqMetrics [14]. Samples were retained if they had at least 1 million reads mapping to genes, at least 40% coding bases from Picard, and at least 75% of reads with a quality score of ≥30, resulting in 604 samples. The strand specificity of the sequencing library was inferred by the fraction of counts on each strand. If the fraction of counts was >70% on a strand, the corresponding counts from that strand were used; otherwise, unstranded counts were used. The read counts were input into DESeq2 [15] (version 1.36.0) to produce VST counts.
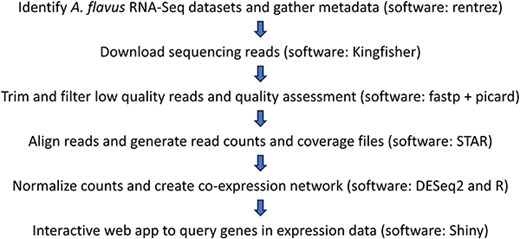
Schematic overview of data collection and processing steps for the AFED.
Generation of co-expression network
Samples were included in the co-expression network if they had at least 10 million reads mapping to genes, resulting in a total of 408 samples, with at least one representative from each of the 48 bioprojects and 14 distinct growth mediums. Genes were included in the network if they had a mean TPM of at least 1 across all samples, resulting in 11 652 genes in the network. To create the network, 68 workflows consisting of combinations of five different steps were evaluated. The combination of steps that were evaluated was either raw counts or downsampling of the counts to 10 million counts; no batch correction or batch correction using ComBat-seq [16] with the bioproject used as the batch; library size normalization using either TPM, UQ (upper quartile) normalization, TMM (trimmed mean of M-values), or VST counts; scaling of the normalized counts using either no scaling, log plus one, inverse hyperbolic sine, or z-score scaling; and correlation using either Pearson’s correlation or Weighted Gene Co-expression Network Analysis [17]. Read counts were converted to TMM using the edgeR [18] package. Pearson’s correlation coefficient (PCC) between all genes was calculated using the cor function in R and edges were kept if they had a PCC of at least 0.5. The networks produced from each of the different workflows were evaluated by functional enrichment. For each gene, the top 100 most correlated genes were tested for enrichment of Gene Ontology terms and biosynthetic gene clusters using a hypergeometric test. Among the sets of top 100 genes that had enriched terms, the number of genes that shared the same term as the query gene were totalled (Supplementary Fig. 1). The workflows that scored the best using biosynthetic gene cluster annotation did not also have the best score using Gene Ontology. Since genes in biosynthetic gene clusters are known to exhibit co-expression patterns [19, 20] reflecting their coordinated regulation, we decided to use the network that scored the best for enrichment of biosynthetic gene clusters in the web application: no downsampling, no batch correction, UQ normalization, no scaling, and Pearson’s correlation. Subnetworks for the web application were made by filtering the edges for a minimum of 0.5 absolute edge weight, extracting the first-order neighbourhood of the query genes, including all edges between the nodes within this neighbourhood, and limiting the number of edges to the topmost 50 000 by absolute edge weight.
Web application development
The web application was made using the Shiny R package [21] (version 1.8.1.1). The mouse hover and click interactivity for several of the tools was done using the Plotly R package [22] (version 4.10.4). The heatmap tool was made using the ComplexHeatmap [23] (version 1.4.0) and tidyHeatmap [24] R packages (version 1.10.0). The clustering of the rows and columns for the heatmap was done using the Euclidian distance and complete-linkage clustering. Visualization of the co-expression network was done using the visNetwork R package [25] (version 2.1.2). Functional enrichment in the co-expression tool uses a one-sided Fisher’s exact test with all the genes in the entire network used as the background gene set. The enrichment results are filtered for an adjusted P-value of <.05 using the False Discovery Rate method. The PCA was done using the prcomp function from R with VST counts as input. The genome browser was made using the JBrowseR R package [26] (version 0.10.2). The RNA-seq coverage genome browser track was made by taking the output of unstranded wiggle files by STAR and using WiggleTools [27] (version 1.2.11) to calculate the mean coverage across all samples.
Quality control
Quality control at the level of the sequencing reads was carried out with fastp and at the level of the mapped reads using Picard CollectRnaSeqMetrics. Using the fastp quality report of the trimmed reads, samples were removed that had <75% of reads with an average quality of 30, which removed 4 samples from the 623 that were initially included. Using the Picard report of the mapped reads, an additional 15 samples were removed that had <40% of reads mapping to coding sequence.
Use case: resolving merged biosynthetic gene clusters through co-expression analysis
Secondary metabolites are chemicals that improve fitness of an organism but are not essential for survival. Many secondary metabolites play important roles mediating inter- and intraspecies interactions in the environment but can also be beneficial—or toxic—to human health (ref). Discovery of the next generation of novel, bioactive secondary metabolite relies heavily on genomic analysis of microorganisms. Microbes produce secondary metabolites through tightly regulated biosynthetic genes that are clustered together [28]. However, accurate prediction of biosynthetic gene cluster boundaries remains a significant challenge in natural product discovery [29]. Current computational tools primarily rely on sequence-based features and proximity rules to define cluster boundaries, leading to frequent overestimation of cluster size. This limitation can complicate efforts to associate clusters with their corresponding metabolites and characterize their biosynthetic pathway, particularly in gene-dense fungal genomes where clusters are often adjacent.
We demonstrate the utility of AFED by delineating a large, incorrectly predicted A. flavus biosynthetic gene cluster, which was originally reported by Georgianna et al. [30] using Secondary Metabolite Unique Regions Finder [31]. This large cluster (‘cluster 21’) was subsequently experimentally shown to encompass discrete clusters responsible for the biosynthesis of imizoquin [27] and aspirochlorine [28]. Despite their genomic proximity, these two clusters were shown to produce structurally distinct secondary metabolites through independent biosynthetic pathways. We used our co-expression analysis tool to assess all genes in the originally predicted cluster 21 in an effort to differentiate the imizoquin and aspirochlorine clusters.
Analysis of gene co-expression patterns clearly delineates cluster 21 into two separate co-expression networks (Fig. 3). Our co-expression analysis shows the imizoquin biosynthetic genes (AFLA_064230 to AFLA_064330) form one tightly connected subnetwork, while the aspirochlorine genes (AFLA_064380 to AFLA_064590) form another distinct subnetwork. A single gene, AFLA_064500, is co-expressed between the two biosynthetic gene clusters. This natural separation in the co-expression network accurately reflects the true biological organization of these clusters, which has been validated through experimental characterization of both pathways. The imizoquin cluster consists of 11 genes responsible for producing a family of tripeptide-derived alkaloids [32], while the aspirochlorine cluster contains 22 genes involved in the biosynthesis of the highly modified cyclic dipeptide aspirochlorine [33].
![Previously predicted large gene cluster is accurately delineated in two biosynthetic gene clusters. Using co-expression analysis cluster 21 [26] is shown to be comprised of two distinct gene clusters: imizoquin (blue) and aspirochlorine (yellow).](https://oupdevcdn.silverchair-staging.com/oup/backfile/Content_public/Journal/database/2025/10.1093_database_baaf033/12/m_baaf033f3.jpeg?Expires=1773633491&Signature=HV1mbIvjw9HFqel3I8uJXoSgd1ZsRMQ6vzInA7h3ceQAutaXej8j1-tvhFU56RKjaTgqBEN5mPeaH8Ozpxmu451iKJimvjup2M2k5AkoO0dSLr16W~SKqxr~o08VGP1gTzAJ4jrf6RCnrYgq~8QtlCJaAxdluGEvXi15n3YzpVNfEAHpQqilPKgAAoc~EO-mfc9tQkh5ckxrchz27vNBCc4~~RpV-n6OMyOVIRa92g9ICdWiIMRylxFVbJQ1fEeGliDks-4rtqpLoITBPdJ8ZqDHUgBK83hh9c~zrP44-nJnhEtzcHdcW3EbuQL1j1D3Fgx6f2UffWC4m52r7mhgZg__&Key-Pair-Id=APKAIYYTVHKX7JZB5EAA)
Previously predicted large gene cluster is accurately delineated in two biosynthetic gene clusters. Using co-expression analysis cluster 21 [26] is shown to be comprised of two distinct gene clusters: imizoquin (blue) and aspirochlorine (yellow).
This example highlights how co-expression analysis can complement existing biosynthetic gene cluster prediction tools by providing additional evidence for cluster boundaries, especially when sequence-based methods merge adjacent clusters.
Conclusion
AFED provides a valuable resource for exploring transcriptomic data from the important crop pathogen and aflatoxin-producing fungus, A. flavus. The database contains easy-to-use tools to probe gene expression in multiple and complementary ways. By incorporating data from all publicly available RNA-seq experiments, AFED enables researchers to examine gene expression patterns, co-expression relationships, and functional enrichment in A. flavus under many different experimental conditions. The database’s interactive features, including bar plots, heatmaps, and co-expression network tools, allow users to conduct in-depth analyses and probe molecular mechanisms underlying A. flavus growth, virulence, and toxin production. Furthermore, the integration of a genome browser with RNA-seq coverage tracks ensures that gene structures are accurately represented, enhancing the reliability of the data. The database will be updated periodically with new RNA-seq datasets. This will ensure that AFED continues to be an up-to-date resource for advancing our understanding of A. flavus biology and developing strategies to mitigate its impact on agriculture and human health.
Author contributions
B.M.M. downloaded and processed the RNA-seq datasets and created the web application. B.M.M. and M.D.L. wrote the paper.
Supplementary data
Supplementary data is available at Database online.
Conflict of interest:
None declared.
Funding
This work was funded by the United States Department of Agriculture (grant no. 6054-41420-009-000-D).
Data availability
The raw and normalized read counts can be accessed from the Ag Data Commons Figshare repository (https://doi.org/10.15482/USDA.ADC/26408044). The entire datasets of normalized and raw read counts, as well as co-expression weights and functional annotation, are available to download from within the app. The web application can be accessed at https://a-flavus-expression-db-jyqnpeuvta-uc.a.run.app. The code used to produce the analyses and web application are available on GitHub at https://github.com/kcamnairb/a_flavus_expression_db.
