-
PDF
- Split View
-
Views
-
Cite
Cite
Jason M. Green, Jaturon Harnsomburana, Mary L. Schaeffer, Carolyn J. Lawrence, Chi-Ren Shyu, Multi-source and ontology-based retrieval engine for maize mutant phenotypes, Database, Volume 2011, 2011, bar012, https://doi.org/10.1093/database/bar012
Close - Share Icon Share
Abstract
Model Organism Databases, including the various plant genome databases, collect and enable access to massive amounts of heterogeneous information, including sequence data, gene product information, images of mutant phenotypes, etc, as well as textual descriptions of many of these entities. While a variety of basic browsing and search capabilities are available to allow researchers to query and peruse the names and attributes of phenotypic data, next-generation search mechanisms that allow querying and ranking of text descriptions are much less common. In addition, the plant community needs an innovative way to leverage the existing links in these databases to search groups of text descriptions simultaneously. Furthermore, though much time and effort have been afforded to the development of plant-related ontologies, the knowledge embedded in these ontologies remains largely unused in available plant search mechanisms. Addressing these issues, we have developed a unique search engine for mutant phenotypes from MaizeGDB. This advanced search mechanism integrates various text description sources in MaizeGDB to aid a user in retrieving desired mutant phenotype information. Currently, descriptions of mutant phenotypes, loci and gene products are utilized collectively for each search, though expansion of the search mechanism to include other sources is straightforward. The retrieval engine, to our knowledge, is the first engine to exploit the content and structure of available domain ontologies, currently the Plant and Gene Ontologies, to expand and enrich retrieval results in major plant genomic databases.
Database URL:http:www.PhenomicsWorld.org/QBTA.php
Background
Major plant genome databases like MaizeGDB (1), Gramene (2), TAIR (3), SGN (4), Soybase (5) and Oryzabase (6) have compiled and organized large quantities of data for their respective research communities. Though enormous amounts of new data are being generated and submitted, completion of the respective genomes is expected to increase the rate of data collection even more. Currently, each group provides browsing capabilities to allow individuals to sift through the available data as well as basic search mechanisms, mainly in the form of structure query language (SQL) queries, to aid users in locating specific information. While these search mechanisms meet basic needs of plant science researchers, they will become decreasingly useful because of several shortcomings.
One limitation that will cause problems in the future is a failure to rank search results by similarity to the query, which is a by-product of the Boolean style retrieval (7) used by most current plant search mechanisms. Instead, search results are sorted idiosyncratically by some field, which is sufficient when databases and result sets are relatively small. However, as database sizes increase causing result sets to become larger, manual perusal through a list of arbitrarily ordered or alphabetized results to find meaningful information will become tedious, inefficient and slow. To locate desired information more quickly, ranking of retrieved results according to their similarity to the query will be necessary.
A second issue is the limited utilization of free-text fields. A limited number of search mechanisms exist in the plant community that make use of free-text descriptions; most appear to rely on making selections from predefined lists of characteristics. Those mechanisms that do search free-text fields treat the description as a single string for character matching (description prefix, description suffix, description contains, etc), which is not sufficient due to variations in phenotype descriptions. More advanced information retrieval methods can be implemented to take better advantage of the wealth of information available in these fields.
A third shortcoming is the limited utilization of domain ontologies in current retrieval methods. Large amounts of time, money and energy have been put forth toward the development of several plant-related ontologies (8, 9). Though the rich knowledge embedded in these ontological structures is particularly well-suited to retrieval, especially for improving the efficiency and coverage of retrieved results, the domain ontologies remain underutilized. In the information retrieval community, ontologies have been used extensively for word sense disambiguation, which is the complex task of determining the correct meaning of a polysemous word from its context (10–12); thematic summarization and concept mapping, which involves identifying broad concepts in free text (13–15); and query expansion, which is a technique of enriching a query by adding additional relevant terms to it (16–18). State-of-the-art query expansion with ontologies generally uses hierarchical relationships, typically parents and children (18), and this is one technique that can be employed to improve the accuracy and coverage of plant phenotype searches.
As research in comparative and systems biology draws more attention, the information needs of researchers in these areas will become vastly more complex, and search mechanisms will be needed that can more fully utilize and integrate stored information to better accommodate these information needs. We have developed a flexible, advanced search mechanism that seeks to overcome the described shortcomings. This retrieval engine is designed to be multi-source, meaning it integrates multiple related free-text sources, to aid the user in retrieving desired information. The current version of the search engine combines three text sources that are associated with phenotypic variations in MaizeGDB. In total, the 2083 variations present in our local database are linked to 4103 phenotype image captions, 559 loci (a total of 1539 locus descriptions) and 32 gene products (a total of 32 descriptions).
The retrieval engine is also designed to utilize the knowledge and structure of existing domain ontologies for query expansion, with the expectation of improving the contextualization of the query. Given the above text sources, the Plant Ontology (PO) (9) and Gene Ontology (GO) (8) were natural choices for inclusion in the search engine, as they had frequent matches to terms in these text sources. As depicted in Table 1, PO terms occurred in nearly 73% of phenotype captions with PO terms and GO terms each appearing in roughly 39% of locus descriptions.
| Text Source . | Size . | Number with PO terms (%) . | Number with GO terms (%) . |
|---|---|---|---|
| Phenotype description | 4103 | 3009 (73.3) | 615 (15.0) |
| Locus description | 1539 | 584 (38.0) | 598 (38.9) |
| Gene product description | 32 | 4 (12.5) | 9 (28.1) |
| Text Source . | Size . | Number with PO terms (%) . | Number with GO terms (%) . |
|---|---|---|---|
| Phenotype description | 4103 | 3009 (73.3) | 615 (15.0) |
| Locus description | 1539 | 584 (38.0) | 598 (38.9) |
| Gene product description | 32 | 4 (12.5) | 9 (28.1) |
| Text Source . | Size . | Number with PO terms (%) . | Number with GO terms (%) . |
|---|---|---|---|
| Phenotype description | 4103 | 3009 (73.3) | 615 (15.0) |
| Locus description | 1539 | 584 (38.0) | 598 (38.9) |
| Gene product description | 32 | 4 (12.5) | 9 (28.1) |
| Text Source . | Size . | Number with PO terms (%) . | Number with GO terms (%) . |
|---|---|---|---|
| Phenotype description | 4103 | 3009 (73.3) | 615 (15.0) |
| Locus description | 1539 | 584 (38.0) | 598 (38.9) |
| Gene product description | 32 | 4 (12.5) | 9 (28.1) |
Implementation
Multi-source retrieval concept
In standard information retrieval systems, a query is submitted to a search engine, which then attempts to retrieve and rank the most relevant documents from the underlying corpus. However, in the case of multi-source retrieval, where a document is linked to other documents from other sources, the traditional retrieval model formulations cannot be directly applied, as the engine must be capable of retrieving and ranking groups of documents.
To make this more concrete, consider the set of three sources for the maize mutant phenotype search engine depicted in the top half of Figure 1. Each phenotype variation is linked to zero or more documents from each of the text sources. Thus, when a phenotype search is submitted, the retrieval engine will need to consider sets of related documents (the bottom half of Figure 1) from various sources, e.g. consisting of all related phenotype, locus and gene product descriptions. Collectively, these sets of documents, referred to as a folders, contain the information used for retrieval, and so retrieval and ranking are performed on folders rather than individual documents. For the remainder of this article, the term folder will be used to designate the set of documents from all sources related to a specific mutant phenotype.
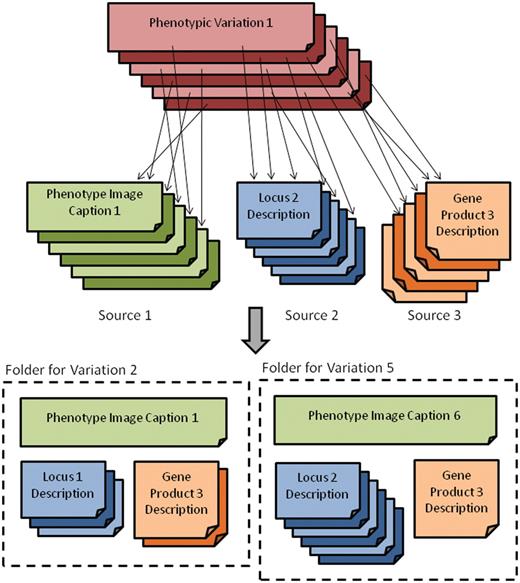
Depiction of the main grouping source and its relationship to the various text sources (top) as well as the folder view (bottom) where related documents for phenotypic variations are grouped.
The simplest solution to retrieving and ranking groups of documents is to merge the text from each document of a folder, referred to as a member or component document, into one mega-document. While this solution does have the advantage of allowing the use of the standard vector space retrieval model (19), it does not, however, reflect the data making up these folders very well. This is because the phenotype descriptions, locus descriptions and gene product descriptions are describing very different entities in the maize domain. Thus, there is variability in the distribution of specific terms, both in terms of usage and rarity, between text sources. This can be illustrated concretely by examining the variability of ontology terms across these sources. Because the GO contains terms related to genes and gene products, we would expect these terms to appear more often in locus and gene product descriptions than in phenotype ones. Likewise, since the PO contains plant anatomy and morphology terms, we expect these to appear most often in the phenotype descriptions and, to a lesser extent, in the locus descriptions. By examining Table 2, this is precisely the situation we find in the MaizeGDB mutant phenotype collection. The trend shown is that PO terms appear less frequently as we move from phenotype to locus to gene product descriptions, with precisely the opposite pattern present with GO terms.
| Average terms/document . | GO . | Text source . | PO . | Average terms/document . |
|---|---|---|---|---|
| 0.18 | Phenotype description | 1.60 | ||
| 0.55 | Locus description | 1.02 | ||
| 0.34 | Gene product description | 0.16 |
| Average terms/document . | GO . | Text source . | PO . | Average terms/document . |
|---|---|---|---|---|
| 0.18 | Phenotype description | 1.60 | ||
| 0.55 | Locus description | 1.02 | ||
| 0.34 | Gene product description | 0.16 |
| Average terms/document . | GO . | Text source . | PO . | Average terms/document . |
|---|---|---|---|---|
| 0.18 | Phenotype description | 1.60 | ||
| 0.55 | Locus description | 1.02 | ||
| 0.34 | Gene product description | 0.16 |
| Average terms/document . | GO . | Text source . | PO . | Average terms/document . |
|---|---|---|---|---|
| 0.18 | Phenotype description | 1.60 | ||
| 0.55 | Locus description | 1.02 | ||
| 0.34 | Gene product description | 0.16 |
For these reasons, merging all the components of a folder into a single document does not make the most logical sense. The proposed approach is a transformation of this multi-source retrieval problem so that groups of related documents can be retrieved using the vector space model (7).
Approach
Representing folders
To be able to retrieve groups of documents, two issues must be decided. First, the representation of a folder, i.e. a group of related documents, must be addressed, and second, a novel similarity measure between folders and the query must be formulated.
Let K be the set of text sources relevant to a particular query. Let Dk be the set of all documents within source k with D1 denoting the base set, that is, the seed documents or identifiers that are used to build folders. The other document sets Dk, k > 1, are secondary sources with documents related to one or more folders. In this search engine, D1 corresponds to the phenotype variation identifiers, with D2, D3 and D4 being the phenotype image, locus and gene product descriptions, respectively. Let denote document j within document set Dk, and
represent the vector associated with user's text query.
Constructing folder vectors
With the notion of folders formalized, considerations for folder representation and similarity can be addressed. Clearly, to use any variant of the vector space model, each folder must be represented as a vector of constituent term weights. Our approach is to treat the folder as a collection of |K| documents, one for each of the text sources being searched. We form the representative vector for each source by applying some function g(.) to the documents in f(j, k). Two classes of functions that can be used for this purpose are merge and selection.
Merge: With this approach, all the documents in f(j, k) are combined together and treated as a large document. Conventional vector space weighting schemes can be applied to the conglomerate document vector or a summarized version of the combined document. This option may be appropriate when the documents in f(j, k) are more homogeneous, i.e. when each contains a textual description of the same entity. As an example, consider a mutant phenotype that is linked to a single genetic locus, but there may be multiple descriptions of that locus in the database. In this case, the amalgamation or summarization of the set of descriptions is more likely to represent the concept as a whole (e.g. the locus, in this example) than any one document in the set.
Selection: Instead of merging the documents in f(j, k) together, one may alternatively choose to select a particular document from the set to represent the text source. This function class can be used in any situation, but is particularly appropriate when the documents in f(j, k) are more heterogeneous. As an alternative example, consider a mutant phenotype that is linked to several different gene products in the database, each of which has a single description in the database. Each of these descriptions is describing a completely different entity and, therefore, merging all these descriptions does not make sense from a retrieval standpoint. However, if only one of the gene product descriptions represents a good match for a query, then the user may still want to see that mutant phenotype. This can be accomplished by selecting only the best match from f(j, k), i.e. the document from this text source with the maximum similarity to the query. One could consider other schemas for selection that are based on the most average document or simply one selected at random.
Measuring folder similarity
In addition to choosing the function g(.) for each text source, a decision must be made on how to use the |K| vectors comprising the folder to define a similarity measure. Two alternatives (weighted average and folder vector) for the folder similarity are discussed.
System details
Offline and online processing
Using the derived similarity measure, a multi-source retrieval engine can then be implemented using the vector space model. The construction of the search mechanism can be partitioned into two main steps: (i) offline preprocessing of the entire document corpus and (ii) online query processing and retrieval. For offline preprocessing, each document from each source within MaizeGDB proceeds as in Figure 2. Documents are parsed into words and phrases to facilitate matching to ontology concepts. Phrases that do not match ontology terms and synonyms are removed, as are stop words. TFs are calculated for the remaining words and phrases in each document and stored in a MySQL database. Once all the documents have been processed, IDFs are calculated for each word and phrase from each text source and also stored. IDFs are calculated separately for each text source to maintain the differences in term discrimination between sources as shown in Table 1. A PHP script is used to automate the offline processing of all text sources and insert the appropriate information into the MySQL database.
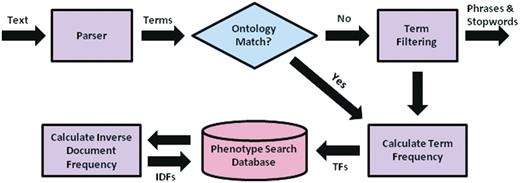
Preprocessing flow chart for the system, including parsing of text descriptions into individual term, matching terms to ontological concepts, calculation of needed quantities for determining term weights, and insertion of terms and quantities into the MySQL database.
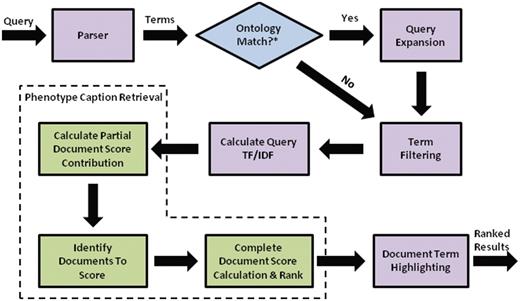
Flow chart for search engine retrieval, from query processing, to similarity calculations for individual text descriptions and folders, to ranking and highlighting of the search results.
The default weights for the various sources, ontologies, and relationships are given in Table 3, though each parameter can be manually adjusted by the user before each search. Default weights for the query expansion terms were based on experimental results from ref. (18).
| Symbol . | Weight description . | Default weight . |
|---|---|---|
| wphenotype | Phenotype source weight | 1.00 |
| wlocus | Locus source weight | 0.20 |
| wgene_product | Gene product source weight | 0.10 |
| wGO | Gene ontology weight | 1.00 |
| wPO | Plant ontology weight | 1.00 |
| wunmatched | Nonontology terms | 0.50 |
| wsynonym | Synonym expansion weight | 0.20 |
| wparent | Parent expansion weight | 0.10 |
| wchild | Child expansion weight | 0.05 |
Query search interface
The query interface for the search engine is depicted in Figure 4 and contains the standard text box for the user's free-text query as well as all the weighting options for each type of term, located in the ‘search options’ box underneath these controls. Each column of controls represents a related set of options.
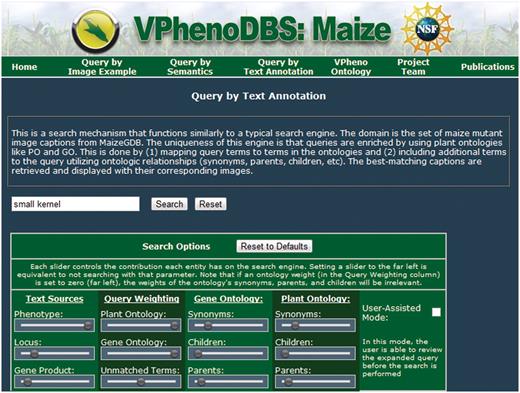
Query interface for the multi-source ontology-based retrieval engine for maize mutant phenotypes.
The first column regards the available searchable text sources. The position of the slider bars can be used to select how much emphasis to place on each source relative to the other sources, ranging from 0, which corresponds to no weight (slider at the far left), to 1, which corresponds to the greatest amount of emphasis (slider at the far right). The default values for the text sources are given in Table 3.
Similarly, the second column controls the emphasis of different types of terms present in the query. The top two sliders control the importance of terms matching to GO and PO, respectively; the bottom slider in this column controls the weight for query terms that did not match an ontology. This gives the user the flexibility to really stress specific types of terms.
The third and fourth columns control the emphasis of terms added through query expansion from the GO and PO, respectively. These sliders determine what kinds of ontology terms are used to expand the query and how much weight is given to each type of term (again, relative to the other term types). Initially, the expansion terms are given fairly low weights to guide the search primarily towards the query terms. Of the expansion terms, synonyms are defaulted with the most weight, followed by parent terms and then children, in accordance with the results in ref. (18).
Ranked results interface
After the query is submitted, the search engine retrieves and ranks folders in decreasing order of similarity to the query. For the sample query ‘small kernel’, the results page is shown in Figure 5. At the top of the page, the user's query and the current system weights are redisplayed in the search interface. This interface is repeated so that the user can make adjustments to the query if desired and resubmit.
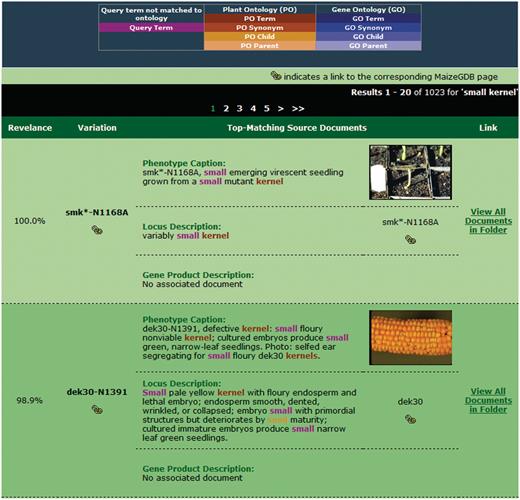
Sample search results for our retrieval engine using the query ‘small kernels’. Highlighted terms indicate matches to the query (including original terms and terms included through query expansion), with the color providing information about the term.
When performing query expansion with synonyms, parents and/or children, it is possible that a query will be enriched with many terms from the available ontologies. As such, results containing few words from the original query may appear in the top-ranked results if the expansion weights are set sufficiently high. To aid the user in determining which terms were added and how they relate to the query, color highlighting of terms is provided. Terms matched to or added from a specific ontology are given the same general color. Different shades of that color will distinguish the relationship as matched term, synonym, parent, or child and are defined in the legend. For example, the term ‘seed’ appears in the second result in Figure 5 in an orange color, indicating a child relationship to the PO synonym ‘kernel’.
Results and discussion
The developed multi-source ontology-based maize mutant phenotype search engine utilizes interconnected free-text fields from MaizeGDB, specifically descriptions of phenotypes, loci and gene products, as well as two domain ontologies, the GO and PO. Users are given the ability to search with any combination of text sources and ontologies and can adjust the weights of these entities as desired to customize retrieval of specific queries. This is the first retrieval tool in the plant community that utilizes sophisticated information retrieval techniques to search free-text fields and provide ranking of results according to similarity to the query and that utilizes domain ontologies in this manner for query expansion.
The search engine was evaluated according to retrieval performance, in terms of speed and accuracy, as well as scalability. The setup and results of the corresponding experiments are described below. All these experiments were conducted on a standalone development server with Intel X5570 dual 2.93 GHz quad core CPU and 72 GB of RAM.
Retrieval performance
Experiments were conducted to measure both the speed and accuracy of the developed search engine. For all experiments, the list of 29 test queries in Table 4 was used. These test queries included a set of anatomical terms, most of which were linked to phenotypic variations in MaizeGDB, anatomical terms plus one or more modifiers and other miscellaneous queries.
| ID . | Query . |
|---|---|
| 1 | Lysine |
| 2 | Gibberellins |
| 3 | Aleurone |
| 4 | Pericarp |
| 5 | Mottled appearance |
| 6 | Tassel |
| 7 | Purple aleurone |
| 8 | Endosperm |
| 9 | Tassel branch |
| 10 | Andromonoecious plant |
| 11 | Leaf |
| 12 | Leaf blade |
| 13 | Necrotic tissue |
| 14 | Seedling |
| 15 | Narrow leaf |
| 16 | Kernel |
| 17 | Yellow leaf |
| 18 | Ear |
| 19 | Broad leaf |
| 20 | Segregating ears |
| 21 | Collapsed kernels |
| 22 | Floury kernel |
| 23 | Immature ear |
| 24 | Small kernel |
| 25 | Broad green leaf |
| 26 | Opaque dented kernel |
| 27 | Small floury kernel |
| 28 | Small yellow kernel |
| 29 | Leaf blade with white stripes |
To determine the overall speed of the retrieval system, each query was executed 20 times against one, two and all three text sources. The overall average retrieval time for all the test queries in all situations was measured at 2.16 s/query. The fastest query was ‘lysine’, which completed in 0.28 s but only had seven matching documents in the database. The slowest query was ‘leaf blade with white stripes’, which without query expansion partially matched 452 phenotypic variations, and finished in 5.67 s.
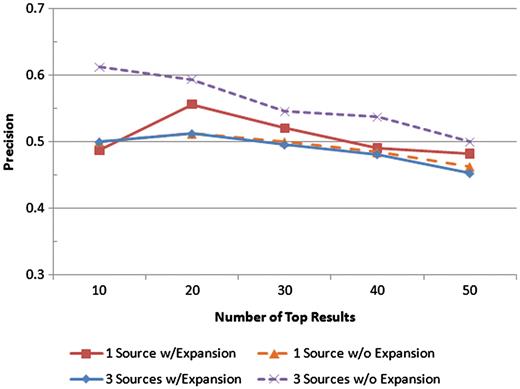
Precision was measured at the top 10, 20, 30, 40 and 50 results for four scenarios: one text source with query expansion, one text source without query expansion, all three text sources with query expansion, and all three text sources without query expansion. The precision values at each of those levels for each scenario are shown.
These ideas are reinforced further by looking at the some of the precision–recall plots for the individual queries. Consider Figure 7, which shows the results for the ‘endosperm’ and ‘ear’ queries. While all the scenarios for ‘endosperm’ perform comparably at the early recall levels, it is the scenario with all sources and with query expansion that maintains the highest precision for the higher recall levels. In addition, by utilizing these features, the result set is able to pick up more than 90% of all the variations whose affected body part is ‘endosperm’ versus roughly 45% for the single source search without expansion. The ‘ear’ query is a quite clear example of how extra text sources and query expansion can improve the search results, as the top 10 results all retrieve correct variations, and the precision stays above all the other scenarios for all but one recall level.
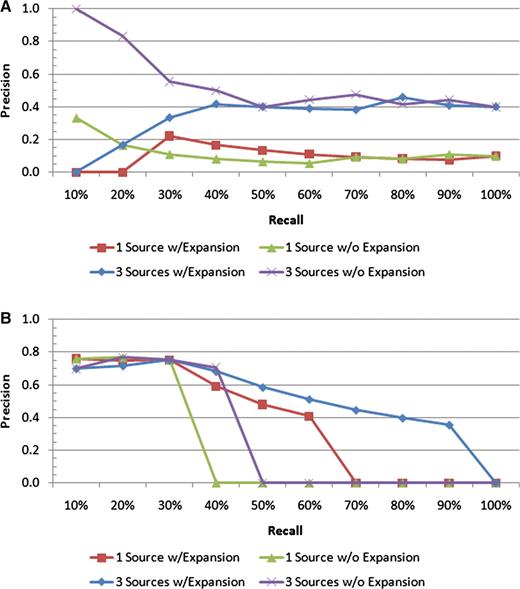
Precision–recall plots for two individual queries: (A) ‘ear’ and (B) ‘endosperm’. For the ‘endosperm query, all four scenarios have similar precision values at low recall levels; however, the scenario with all the text sources and query expansion includes many more of the relevant documents in the result sets than the others, as indicated by the higher precision at the higher recall levels. For the ‘ear’ query, the best performance is achieved by all the text sources with no query expansion.
System scalability
The scalability of the system was assessed using three separate experiments. First, we designed an experiment to examine the effect of query length on retrieval time. Retrieval speed was measured for each of the test queries, which were composed of one, two or three terms. The average query speeds were then used to illustrate the trend in retrieval time as the length of the query increases. Figure 8 shows the average query time for each query using only the caption text source. The figure is organized by query length with the single-word queries on the left, the two-word queries in the middle and the three-term queries on the right. While the average times did increase as query length increased (0.43 s between query lengths of one and two terms, and 1.55 s between query lengths of two and three words), there were overlaps in the retrieval times of individual queries across the sets. It was noted that the more dominant factor in retrieval time was not the number of query terms, but rather the number of descriptions matched by the query terms.
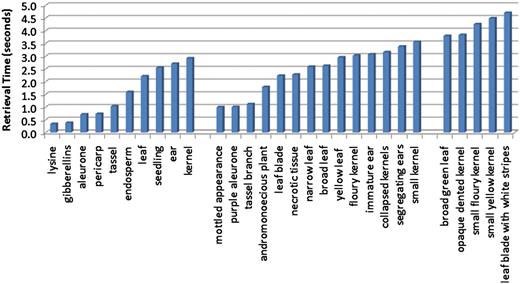
Average retrieval speeds for queries, ordered by query length. The leftmost group corresponds to the single-term queries, and these have the quickest execution times. The middle group contains queries consisting of two terms, and the query speeds for these are on average slightly slower than the single-term queries. The rightmost group of queries all contain three terms, and these are the most time consuming of the queries tested.
Second, in order to determine the effect of the number of text sources on query performance, each of the test queries was executed using just one text source (phenotype captions), two sources (captions and locus descriptions) and all three text sources. For each scenario, each query was executed 20 times with the average retrieval speeds measured and shown in Figure 9. This figure shows slight increases in retrieval time with the inclusion of additional text sources, but not a significant increase. The average increase in retrieval time for all the test queries in adding the second and third text sources was found to be 0.49 and 0.12 s, respectively.
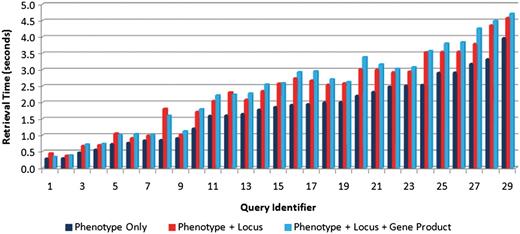
Comparison of retrieval speeds for each of the test queries (see Table 4 for the link between query identifier and query text) executed on one text source (phenotype captions only) (right bars), two sources (phenotype caption + locus descriptions) (middle bars) and three sources (left bars). There is a slight increase in execution as the number of sources increases.
Finally, we designed an experiment to examine how the size of the database, in terms of the number of documents, affects retrieval time. To perform this experiment, smaller databases were generated from the current data set by decreasing the size of the phenotype caption table. Six versions of each phenotype caption table size, which included 20, 25, 33, 50 and 75% of the original table size, were constructed. Each query was executed five times on each of the constructed databases. Figure 10 shows the trend in query performance as the number of documents in the database increased. The 5-fold increase in database size depicted shows an increase in retrieval time from 1.19 s to only 2.42 s. Should the size of the database eventually cause retrieval times to become unacceptable, various strategies could be employed to speed up the search. Performing the search on each text source in parallel and then merging the results of each of those threads could make significant inroads in decreasing retrieval speed. In addition, because the search engine is currently implemented via a PHP application that communicates with a MySQL database, porting portions of the search procedure to a higher performance language, like C++, could also allow for substantial gains in query speeds.
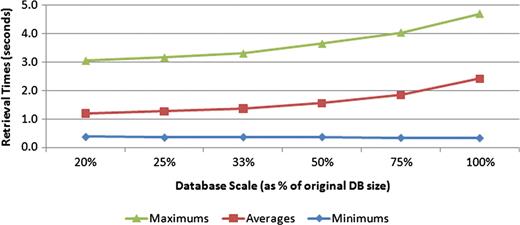
Effect of database size on retrieval speeds. Six different-sized test databases were constructed from subsets of the original data set. All the test queries were executed against each of these test databases, with the minimum, average and maximum query times measured. The trend suggests a nonlinear complexity for the search task.
Limitations
As with any system, there are some limitations to this search mechanism. The first limitation is the requirement for exact matches when pairing terms to ontology concepts. This, at times, prevents the matching of concepts in documents to ontologies and thus prevents the ability to perform query expansion on those terms. For example, the term ‘aleurone’ on its own is not in the PO; however, ‘aleurone layer’ is a concept. Due to the large number of concepts that can be returned by performing a partial match to an ontology concept, it was decided that missing an occasional ontology match was a better alternative than falsely identifying many ontology pairings. Though stemming is performed on words in the text documents, ontologies and queries in an effort to reduce each term to its base word, variations in terms do exist that stemming does not account for. The result of this is the inability to match some variations of words (e.g. ‘necrosis’ and ‘necrotic’ map to ‘necrosi’ and ‘necrot’, respectively). A third limitation of this approach is the potential steep learning curves for users. Because of the built in flexibility, it may take some time for users to get accustomed to the available weighting options and it may take some exploration of the capabilities of the system to learn how to best utilize it.
Future work
There are several places where this project could be expanded through future work. First, we could investigate the use of linked grammars in this type of search engine, which may allow us to weight terms better by considering their word classes (e.g. noun, verb or adjective). Query expansion is performed automatically in our search engine; however, we also in the future plan to incorporate user-assisted query expansion, which allows the user to see the list of candidate expansions to the query and remove any unwanted terms from that list before the search is performed. We are also investigating the possibility of giving the user the flexibility to weigh individual terms in the query (including candidate expansions) rather than one weight for an entire class of terms. In addition, we would like to investigate using relevance feedback techniques to automatically determine user-driven weights for the various parameters. Currently only free-text sources are searchable through this mechanism; however, future development to integrate other kinds of sources into this search engine is planned. First, attribute fields, like those searched in current plant retrieval tools, will be incorporated. This would allow a phenotype description search to be limited to, for example, only those phenotypes linked to a specific trait or anatomical body part or to gene products of certain types. Leveraging attribute searches in conjunction with free-text information is promising. We also hope to explore the possibility of including nontext sources, like images and sequences, into the search mechanism as well. Phenotype searches using these modalities have already been developed; MaizeGDB has a sequence search mechanism called POPcorn available, and we have already explored in a previous work (20) how to represent phenotype images as feature vectors and perform image searches. In both cases, however, an approach to intelligently combine these various types of sources remains unstudied. Nevertheless, such a hybrid search mechanism that merges varied information sources would have great potential.
Finally, the MaizeGDB resource itself is in the early stages of a full redesign. One component of the redesign will be the inclusion of the system described here as MaizeGDB's phenotype search tool. Full deployment of the new resource including the VPhenoDBS: Maize search is anticipated for March of 2013.
Conclusions
We have developed a novel retrieval engine for maize mutant phenotypes. The main contribution is the development of multi-source retrieval, in which several interconnected text sources are utilized for searching and folders are retrieved and ranked for the user. Folder representation was defined, and a similarity measure was constructed so that traditional information retrieval techniques could be employed. The developed search engine also utilized domain ontologies for query expansion to help improve the accuracy and coverage of search results. This is the first such retrieval tool in the plant community. As plant genome databases continue to increase in size, next-generation search mechanisms will be needed to meet the needs of plant science researchers in a timely fashion.
Funding
National Science Foundation (DBI-0447794) and the National Library of Medicine (NLM) Bioinformatics and Health Informatics Training (BHIRT) (2T15LM007089-17 to J.G.). Funding for open access charge: Shumaker Endowment for Bioinformatics.
Conflict of interest. None declared.
Acknowledgements
The authors would like to acknowledge MaizeGDB for contributing the data for the retrieval engine as well as the MaizeGDB team itself for fruitful discussions.The multi-source retrieval was developed and implemented by J.G., who also prepared the manuscript. J.H. contributed to the development of multi-source retrieval and also was involved with manuscript preparation. M.S. provided maize expertise, ideas for making the retrieval engine most useful to the plant community, and provided guidance during manuscript preparation. C.J.L. provided insight regarding MaizeGDB, outlined unmet needs of maize researchers that were addressed by this work, and provided guidance during manuscript preparation. C.R.S. directed the project and provided essential guidance during development of the system as well as during preparation of the manuscript.


