-
PDF
- Split View
-
Views
-
Cite
Cite
Roberto Vera Alvarez, Newton Medeiros Vidal, Gina A. Garzón-Martínez, Luz S. Barrero, David Landsman, Leonardo Mariño-Ramírez, Workflow and web application for annotating NCBI BioProject transcriptome data, Database, Volume 2017, 2017, bax008, https://doi.org/10.1093/database/bax008
Close - Share Icon Share
Abstract
The volume of transcriptome data is growing exponentially due to rapid improvement of experimental technologies. In response, large central resources such as those of the National Center for Biotechnology Information (NCBI) are continually adapting their computational infrastructure to accommodate this large influx of data. New and specialized databases, such as Transcriptome Shotgun Assembly Sequence Database (TSA) and Sequence Read Archive (SRA), have been created to aid the development and expansion of centralized repositories. Although the central resource databases are under continual development, they do not include automatic pipelines to increase annotation of newly deposited data. Therefore, third-party applications are required to achieve that aim. Here, we present an automatic workflow and web application for the annotation of transcriptome data. The workflow creates secondary data such as sequencing reads and BLAST alignments, which are available through the web application. They are based on freely available bioinformatics tools and scripts developed in-house. The interactive web application provides a search engine and several browser utilities. Graphical views of transcript alignments are available through SeqViewer, an embedded tool developed by NCBI for viewing biological sequence data. The web application is tightly integrated with other NCBI web applications and tools to extend the functionality of data processing and interconnectivity. We present a case study for the species Physalis peruviana with data generated from BioProject ID 67621.
Database URL: http://www.ncbi.nlm.nih.gov/projects/physalis/
Introduction
Next-generation DNA sequencing technologies (1) have substantially improved in recent years. RNA-Seq-based technologies, also called whole-transcriptome shotgun sequencing, are becoming a preferred method because they provide a very precise measurement of transcript levels and their isoforms (2). RNA-Seq technologies are used routinely for the characterization of well-studied organisms (3–6). The use of RNA-Seq for organisms that lack a reference genome sequence provides an efficient strategy to explore genome regions that are likely to be of most interest to researchers, as we show in our case study of Physalis peruviana (7–11).
Large central resources such as those at the National Center for Biotechnology Information (NCBI), European Bioinformatics Institute (EBI), and Kyoto Encyclopedia of Genes and Genomes (KEGG) invest significant effort to integrate other databases and datasets to provide a high-level service for the global research community (12). Since 2010, NCBI has added a new division for GenBank (13), named Transcriptome Shotgun Assembly Sequence Database (TSA, https://www.ncbi.nlm.nih.gov/genbank/tsa/), which contains shotgun assemblies of sequences deposited in the NCBI Trace Archive (TA) and the Sequence Read Archive (SRA, https://www.ncbi.nlm.nih.gov/sra).
Whole-transcriptome analyses are crucial to study the biology of non-model organisms, particularly for individual laboratories. These analyses identify candidate genes that differ between treatments or populations. However, lists of differentially expressed genes are of limited interest, and external information is necessary to infer their biological function (14). A major step to complement any transcriptome analysis is to associate biological processes, molecular functions, and/or cellular components to the identified transcripts. The Gene Ontology (GO) database is the primary resource for annotating transcriptome data with a controlled vocabulary. GO terms can be used to map BLAST alignments with homologous sequences previously annotated with GO terms (15).
Bioinformatics tools such as BLAST (16, 17), Bowtie 2 (18), and JBioWH (19, 20) are used widely to generate automatic annotation and secondary data from their experiments. BLAST and sequencing read alignments are automatically built, cross-referenced data and are the most common annotation and secondary data generated from primary experimental results. However, these annotations and secondary data cannot be included in manuscript submissions and cannot be published in the GenBank, EMBL, and DDJB primary sequence databases. Consequently, new sequence submissions routinely lack annotation and secondary data. Hence, independent databases and internet applications were developed to solve this problem (3, 12, 21–23). These applications grant access to specific biological data (primary or computed data), which are not available through the main central resources. They are published as independent resources that provide cross-referencing between newly generated data and new sequence submissions.
Several groups have been working to construct automatic workflows, pipelines, and applications to annotate transcriptome data and make them available to the public. In 2013, Jones and Blaxter published afterParty (24), a web-based application for creating, searching, browsing, and visualizing transcriptome data. This application provides an annotation workflow for new sequences that performs BLAST searches against the UniProt database (25) for annotation and uses the InterProScan tool (26) to identify protein domains and regions of interest. The application offers an automatic and easy-to-use workflow. However, the annotation does not include GO terms (27), which are widely used by the scientific community to characterize and organize biological data. Rangel et al. (28) developed an integrated resource named EimeriaTDB to annotate transcripts in protozoan parasites of the genus Eimeria. This database and web application provides both individual and global transcript annotations via a BLAST engine and a web interface. Both individual and global annotations include KOG (29), eggNOG (30), and KEGG Pathway (31) resources in addition to references to GO terms. Although this application provides a well-defined workflow and web interface for their data, the source code is not available, which limits its use in other projects. Janies et al. published a resource named EchinoDB in early 2016 (21). This resource is the first large collection of data for transcriptome samples across the phylum Echinodermata. EchinoDB follows an approach similar as that described for EimeriaTDB, but it is applied to an entire taxonomic phylum rather than a single genus.
Here, we describe a workflow and a web application that provides an automatic pipeline to annotate and publish transcriptome data with GO terms and Enzyme Commission (EC) codes for NCBI BioProjects (https://www.ncbi.nlm.nih.gov/bioproject/). A relational database hosted on an MS SQL server was generated and used as the backend for the web application. This application is integrated with NCBI resources including GenBank, SeqViewer, and BLAST. It also provides a search engine that allows users to perform queries against the database, and a statistics summary page for GO terms. We present a case study for Physalis peruviana (NCBI Taxonomy ID: 126903) using data from BioProject ID 67621 (published at https://www.ncbi.nlm.nih.gov/projects/physalis/).
Materials and methods
Figure 1 shows the global workflow used for data annotation and secondary data generation. The NCBI BioProject ID is used for primary data collection from NCBI web resources. BioProject transcript sequences are retrieved from GenBank, and experimental data are retrieved from the SRA database. Cross-references between transcript IDs and UniProt IDs are generated using BLAST alignments.
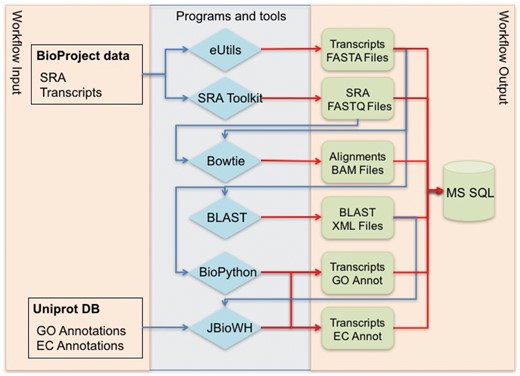
Global workflow for annotating NCBI BioProject transcriptome data.
The JBioWH framework, see Table 1, is used for the annotation of transcripts through an extrapolation of GO terms and EC codes based on cross-references between transcript IDs and UniProt IDs. JBioWH is an open source, platform-independent programming framework that allows a user to build an integrated database from the most popular data sources. This framework is based on a modular relational schema that works with a set of external database resources, which are not necessarily the entire list of supported databases. This feature reduces the dimensions of the relational database and expedites the join operations. Our workflow requires the Taxonomy, Gene Ontology, Uniprot, and Enzyme databases to be loaded into JBioWH.
| Tool . | Version . | Main use . | URL . |
|---|---|---|---|
| EUtils | 4.50 | Advanced method for accessing the NCBI set of interconnected databases from a UNIX terminal window | http://www.ncbi.nlm.nih.gov/books/NBK179288/ |
| SRA toolkit | 2.6.3 | Programmatically access data housed within SRA and convert it from the SRA format to different formats | http://www.ncbi.nlm.nih.gov/books/NBK158900/ |
| BioPython | 1.67 | Python tools for computational molecular biology and bioinformatics | http://biopython.org/DIST/docs/install/Installation.html |
| Bowtie 2 | 2.2.6 | An ultrafast and memory-efficient tool for aligning sequencing reads to long reference sequences | http://bowtie-bio.sourceforge.net/bowtie2/manual.shtml |
| Samtools | 1.3.1 | A suite of programs for interacting with high-throughput sequencing data | http://www.htslib.org/ |
| BLAST | 2.4.0 | The Basic Local Alignment Search Tool (BLAST) finds regions of local similarity between sequences | http://blast.ncbi.nlm.nih.gov/Blast.cgi |
| JBioWH | 6.1.3 | An open-source, platform-independent programming framework that allows a user to build a customized integrated database | https://github.com/r78v10a07/jbiowh-core |
This workflow was designed to use the NCBI BioProject ID as input data. However, it was implemented as separate modules using independent scripts and programs to achieve the final aim. Therefore, the scripts also can be used for non-NCBI data. The first two blue diamonds located in the block ‘Programs and tools’ in Figure 1 are used to retrieve data from the NCBI resources for further processing. The workflow can be easily adjusted to obtain the FASTA and FASTQ files of transcripts as input data. The workflow starts the annotation process from the first two green blocks, shown in ‘Workflow output’ in Figure 1. These readjustments of the workflow render it independent of the NCBI data repositories and extend its usability.
This workflow can be used to annotate a small list of transcripts using a workstation or even a personal laptop. However, it requires a high-performance computing (HPC) infrastructure to process thousands of transcripts. We provide the source code of the scripts and C ++ programs developed for this workflow in a Github repository (https://github.com/r78v10a07/trans-annot-notebook).
Readers should note that this source code excludes the specifications to execute the workflow in the NCBI computational infrastructure. Users should re-adapt the scripts to their computational infrastructure if they want to use them in a project. The database management system used in the demo is SQLite 3, which is easier to understand and use. The relational schema provided in the GitHub repository is the same as that used by the web application, but in this case, the database is hosted on an MS SQL server. In addition, a Jupyter notebook is available for implementation of the workflow (https://github.com/r78v10a07/trans-annot-notebook/blob/master/docs/Notebook.ipynb). The repository can be cloned, and the workflow can be executed using the Jupyter notebook for the Physalis peruviana case study. The available notebook is a demo version that can be executed in a personal laptop as it only annotates a total of ten transcripts.
Data collection, processing and annotation
We describe the steps required to collect, process, and annotate transcripts (Figure 1). This set of computational tools was developed for use in a particular environment, and the tools are not portable. Therefore, we provide a simplified demo version of these scripts in multiple programming languages, which contain the functionality core of our pipeline. The reader may adapt these scripts to their environments and problems. Table 1 presents the bioinformatics tools used in our scripts.
Initially, Entrez Programming Utilities (eUtils) (32) was used to collect transcript sequences in FASTA format from the BioProject identifier. The eUtils program is an advanced collection of tools for accessing the NCBI set of interconnected databases from a UNIX terminal window. The eUtils programs were executed and connected through BASH pipelines to build multi-step queries.
Transcript sequences for the case study (BioProject ID 67621) were retrieved in FASTA format using the eUtils idfetch utility, see eUtils online documentation for more info about idfetch (http://www.ncbi.nlm.nih.gov/books/1/NBK2550). The multi-sequence FASTA file retrieved with idfetch was parsed and split into single-sequence FASTA files using the GenBank accession number as the archive name. BioPython (33) was used to achieve this step in a straightforward and efficient way (see the Jupyter notebook in the Github repository). The resulting files were named using GenBank accession numbers, which enabled easy identification of the transcripts.
The SRA toolkit was used to collect the experimental data from the SRA database (RNA-Seq data in our case study). The SRA toolkit provides a set of programs that converts collected data into multiple file formats. Specifically, fastq-dump was used to retrieve data from the SRA database and convert them to both FASTQ and FASTA formats.
The NCBI eUtils tools were executed from BioPython to retrieve all SRA database IDs linked to the BioProject. Utilities such as esearch and efetch were executed to retrieve and parse the results, respectively.
Bowtie 2 was used to align the experimental data (FASTQ format) with each transcript sequence. This step required the creation of a Bowtie 2 index from each transcript sequence. Then, all experimental data were aligned against those indexes. A BAM file was generated for each transcript sequence.
Each transcript sequence also was aligned against the non-redundant protein sequences collection (NR) database using BLAST. Similar sequences belonging to the kingdom Viridiplantae with bitscore larger than 50 were used to create transcript-UniProt identifier cross-references. These cross-references were used to annotate the transcripts with GO terms and EC codes from the UniProt database. The JBioWH framework created an integrated database linking GO, Enzyme, and UniProt databases with our BLAST results.
BLAST was executed with the default parameters in four threads with tabular output. The result files were inserted into a relational database. Multiple inner joins queries were executed to create cross-references between the BLAST results and the GO terms and EC codes. Additional details regarding the SQL query are presented below.
Finally, in-house programs and scripts were developed using BioPython (33) and BASH to parse, transform, and insert data from Bowtie 2, BLAST, and JBioWH outputs to a relational database. This database was used as the backend for the BioProject final web application.
Website overview
The developed website enables a graphical interaction with the database to visualize the transcripts and their alignments. It provides the following functionalities: (i) describe the BioProject under analysis (Figure 2a), (ii) browse transcript entities with graphical views of their aligned sequence reads, (iii) browse GO terms with a quick view of cross-referenced transcripts, (iv) browse EC codes with a quick view of cross-referenced transcripts, and (v) a statistical page for GO terms classified according to the ontology source. A quick search option also is available for users to find transcripts, GO terms, and EC codes directly. The website is fully integrated with the other NCBI web resources, which enables the use of the other NCBI web tools and applications.
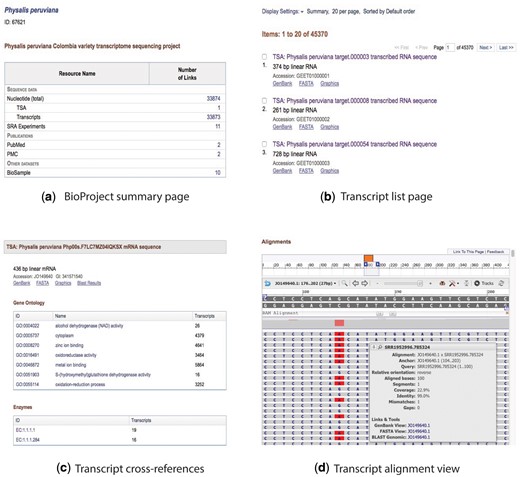
Collage of the content view for the BioProject and transcript pages. (a) BioProject summary page, (b) transcript list page, (c) description and cross-referenced blocks, and (d) alignment view.
Browsing the transcripts
The website provides a page for browsing the transcripts (Figure 2b). It shows the transcript metadata including GenBank title, number of base pairs, molecule type, and accession number. If the transcript has a sequence identification number (GI), it is included in the report. The final line specifies the web links to the graphical view, GenBank sequence, and FASTA sequence. Fast navigation and pagination buttons also are available. Clicking on one of the transcripts brings up a new page that includes the same metadata and tables that show the GO terms and EC codes cross-referenced to the transcript (Figure 2c).
A graphical view of the transcript sequence with the reads used for its construction is shown with SeqViewer (https://www.ncbi.nlm.nih.gov/tools/sviewer/), an embedded tool developed by NCBI for viewing biological sequence data. This feature allows users to interact with the data and perform a visual inspection of the transcript and the reads. SeqViewer presents a coverage graph for the entire sequence and tooltips for each read visualizing the alignment coverage, quality, mismatches, and gaps (Figure 2d).
An additional link is included with the BLAST pre-computed results for the transcript. This link shows the accession numbers for the BLAST hits (with links to the RefSeq main entry), title, taxonomy (with the link to the Taxonomy database), and BLAST result values such as EValue, BitScore, Score, and query length (Figure 3).
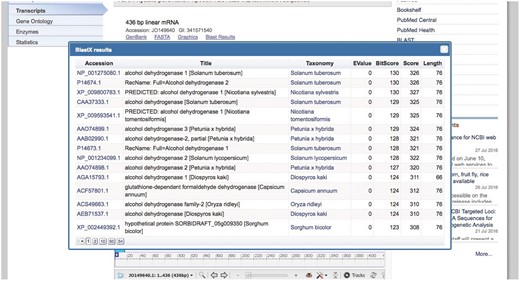
Browsing GO terms and EC codes
Browser pages for GO terms and EC code are available in a similar format as the transcript list page. These pages provide a list of all GO terms and EC codes cross-referenced to the transcripts (Figure 4).
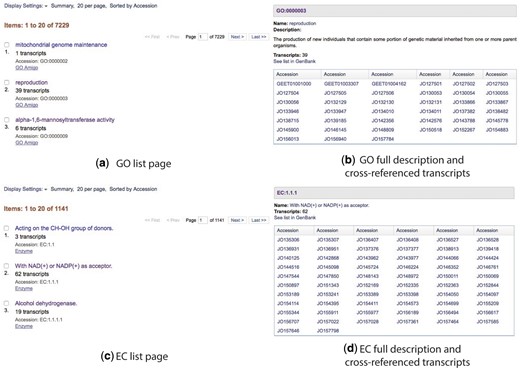
Cross-referenced Gene Ontology and Enzyme Commission lists (a and c) and full descriptions (b and d).
Statistics page
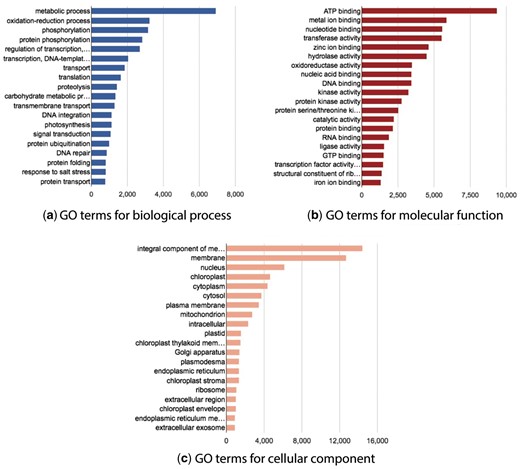
The website also provides a page with some basic GO statistics. This page shows the main GO terms cross-referenced by the BioProject transcripts and grouped by GO name space. Three interactive graphs are provided for each GO namespace: biological process, molecular function, and cellular component (Figure 5).
Database design and website code
The website is written in Django (version 1.9.1), a high-level Python Web Framework, with an MS SQL backend database. The project has one Django application, which contains models (equivalent to the database tables), views (Python functions to render the page), and templates (HTML files). Although this Django application was developed for the Physalis peruviana case study, it can be used to host multiple BioProjects. The database schema developed for this project also was designed to store multiple BioProjects, which provides centralized resources for all processed data. The database schema is shown in Figure 6.
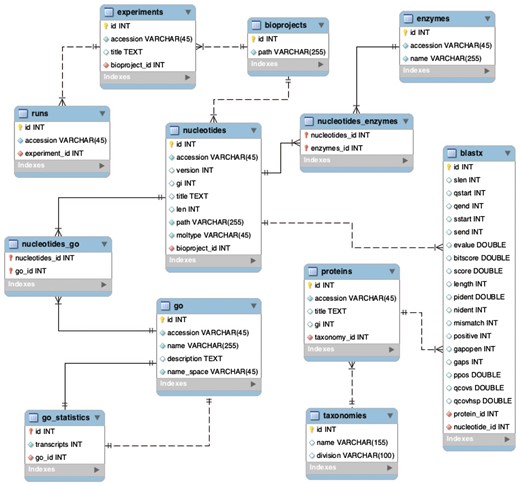
Backend database schema developed to store multiple BioProjects.
A case study of Physalisperuviana
Physalis peruviana (commonly known as Cape gooseberry) is a member of the Solanaceae family, and has become increasing popular because of its nutritional and medicinal value. Our group has been working with this organism for many years. We have produced transcriptome data that are publicly available through the NCBI BioProject PRJNA67621. However, the Physalis peruviana complete genome is not available, and our transcriptome data lack functional and structural annotations.
The workflow presented in this paper was used to annotate the Physalis peruviana transcriptome. We analyzed 45 370 transcripts generated from 11 experiments. Our workflow annotated 81.3% of transcripts with GO terms (36 875 transcripts) and annotated 27.9% of transcripts with EC codes (12 677 transcripts).
Our previous paper reports that the transcript JO140768 (cDNA Php00a06743.16696) and S. lycopersicum cDNA Solyc01g095570.2.1 have the same gene models on S. lycopersicum chromosome SL2.40ch01. The Solyc01g095570.2.1 gene is annotated into the Sol Genomics Network with the GO terms GO:0016020 (membrane, cellular component) and GO:0005743 (mitochondrial inner membrane, cellular component) (see https://solgenomics.net/feature/17693139/details). Our workflow complements the previous work by annotating the transcript with the same GO terms and adding the term GO:0016021 (integral component of membrane, cellular component). Additionally, two other biological processes were identified for this transcript, including the terms GO:0006810 (transport, biological_process) and GO:0055085 (transmembrane transport, biological_process).
The top seven BLAST results for this transcript are presented in Table 2. Four of seven aligned proteins belong to S. lycopersicum, and all of the aligned proteins belong to the Solanaceae family. Readers can easily verify that the transcript record in Genbank (https://www.ncbi.nlm.nih.gov/nuccore/JO140768) and the protein records in RefSeq (links in Table 2) do not provide any GO or EC annotation, which means that our website is the only public application providing this kind of annotation for Physalis peruviana. Complete information for transcript JO140768 can be accessed from our BioProject page at https://www.ncbi.nlm.nih.gov/projects/physalis/viewer/68810/.
| Accession . | Title . | Taxonomy . | EValue . | BitScore . | Score . | Length . |
|---|---|---|---|---|---|---|
| XP_009779970.1 | PREDICTED: mitochondrial adenine nucleotide transporter ADNT1-like isoform X1 (Nicotiana sylvestris) | Nicotiana sylvestris | 0 | 635 | 1639 | 337 |
| XP_010326870.1 | PREDICTED: mitochondrial adenine nucleotide transporter ADNT1 isoform X1 (Solanum lycopersicum) | Solanum lycopersicum | 0 | 633 | 1633 | 337 |
| XP_010326872.1 | PREDICTED: mitochondrial adenine nucleotide transporter ADNT1 isoform X2 (Solanum lycopersicum) | Solanum lycopersicum | 0 | 626 | 1615 | 337 |
| NP_001275102.1 | Mitochondrial carrier-like protein (Solanum tuberosum) | Solanum tuberosum | 0 | 625 | 1,613 | 337 |
| NP_001275102.1 | Mitochondrial carrier-like protein (Solanum tuberosum) | Solanum tuberosum | 0 | 625 | 1,613 | 337 |
| XP_004248074.1 | PREDICTED: mitochondrial adenine nucleotide transporter ADNT1 (Solanum lycopersicum) | Solanum lycopersicum | 0 | 595 | 1,534 | 338 |
| XP_004248074.1 | PREDICTED: mitochondrial adenine nucleotide transporter ADNT1 (Solanum lycopersicum) | Solanum lycopersicum | 0 | 595 | 1,534 | 338 |
Conclusions
Ongoing progress has greatly improved data management and interconnectivity of centralized biological data resources. However, some transcriptome data remain poorly annotated or in raw format. Because of this situation, many research projects generate annotations and secondary data that are available through third-party applications interconnected to the centralized biological data resources. These applications provide automatic pipelines for data annotation that can be accessed by nonspecialized researchers.
Our developed workflow generates an automatic pipeline for the annotation of poorly annotated transcriptome data submitted to NCBI BioProjects. The workflow is based on open-source bioinformatics tools and a set of Python- and BASH-based scripts that are publicly available and further developed in-house. Other groups can implement this pipeline to generate automatic annotations and secondary data by adapting our source code (available in the Github repository) to their computational infrastructure.
The web application developed for the Physalis peruviana case study, named PhysalisDB, is freely accessible through the project website. It is hosted at NCBI, and it is tightly integrated with the central databases and web tools. The website offers access to annotations and secondary data generated for Physalis peruviana that are not published in the main biological databases. These data would save time and resources for other research projects focused on Physalis peruviana.
Future work will extend this workflow to other BioProjects with similar datasets that lack a complete genome. New annotations and third-party data such as KEGG pathways and related resources will be cross-referenced in future releases. Finally, we encourage readers to send recommendations and requests to the following address: marino@ncbi.nlm.nih.gov.
Funding
Funding for the open-access publication charge was provided by NIH/NLM/NCBI. This research was supported by the Corporación Colombiana de Investigación Agropecuaria (CORPOICA) and the Intramural Research Program of the NIH, NLM, and NCBI. The postdoctoral fellowship to N.M.V. was funded by a partnership between NIH and CNPq.
Acknowledgements
We thank Richa Agarwala for transcriptome assembly, Mark Johnson for his help and advice about Django, Anatoliy Kuznetsov and Victor Joukov for the support and contribution to integrate SeqViewer into our web application, and the IT support team at NCBI for troubleshooting server-related issues.
Conflict of interest. None declared.
References
Author notes
Citation details: Vera Alvarez,R., Medeiros Vidal,N., Garzón-Martínez,G.A. et al. Workflow and web application for annotating NCBI BioProject transcriptome data. Database (2017) Vol. 2017: article ID bax008; doi:10.1093/database/bax008


